
10 min read
Overview
A program in production needs monitoring for suspicious activity, such as an unexpected authority change or upgrade proposal. When one happens, you want to know within seconds, not from a user's DM the next morning.
Solana Microscope is a free, self-hosted early warning system for the calls that matter on a Solana program, such as authority changes, risk-parameter updates, and multisig proposals. It streams confirmed transactions and decodes them against the program's Anchor Interface Definition Language (IDL) file, including calls that arrive through cross-program invocations (CPIs). Its usage dashboards and alerts both come from that decoded data. It also decodes Squads multisig activity, so one deployment watches a program and the multisig that can upgrade it. One command, just up, builds and starts the whole stack.
If you ship a program, you point Microscope at your own. If you depend on someone else's program, the same tool points outward and watches the governance of a protocol you've integrated with. This guide takes the second approach. It points Microscope at Jupiter Lend, a live mainnet lending program, feeds it from a Quicknode Solana gRPC endpoint, and alerts on the changes that matter to the program and the multisig that controls it.
- Solana Microscope decodes one program's instructions and events from a gRPC stream and shows them in Grafana, all running in Docker Compose.
- A Quicknode Solana gRPC endpoint connects with its URL and token.
- You define alerts in one config file, and a single command starts the stack and loads them into Grafana.
- The most important alerts watch for a change to who controls the program or a proposal on the multisig that can upgrade it. These should rarely fire, and when one does, you hear about it within seconds.
- A multisig upgrade shows up step by step as it's proposed, approved, and executed.
What You Will Need
This guide assumes comfort with a terminal and a working knowledge of what an Anchor IDL describes.
- A Quicknode account with a Solana Mainnet endpoint and Solana gRPC (Scale plan and up)
- Docker Engine with Docker Compose v2
- just, the command runner Microscope's workflows use
| Dependency | Version |
|---|---|
| Solana Microscope | 0.1.0 (commit 9c9e378) |
| Docker Compose | v2 |
How Does Solana Microscope Work?
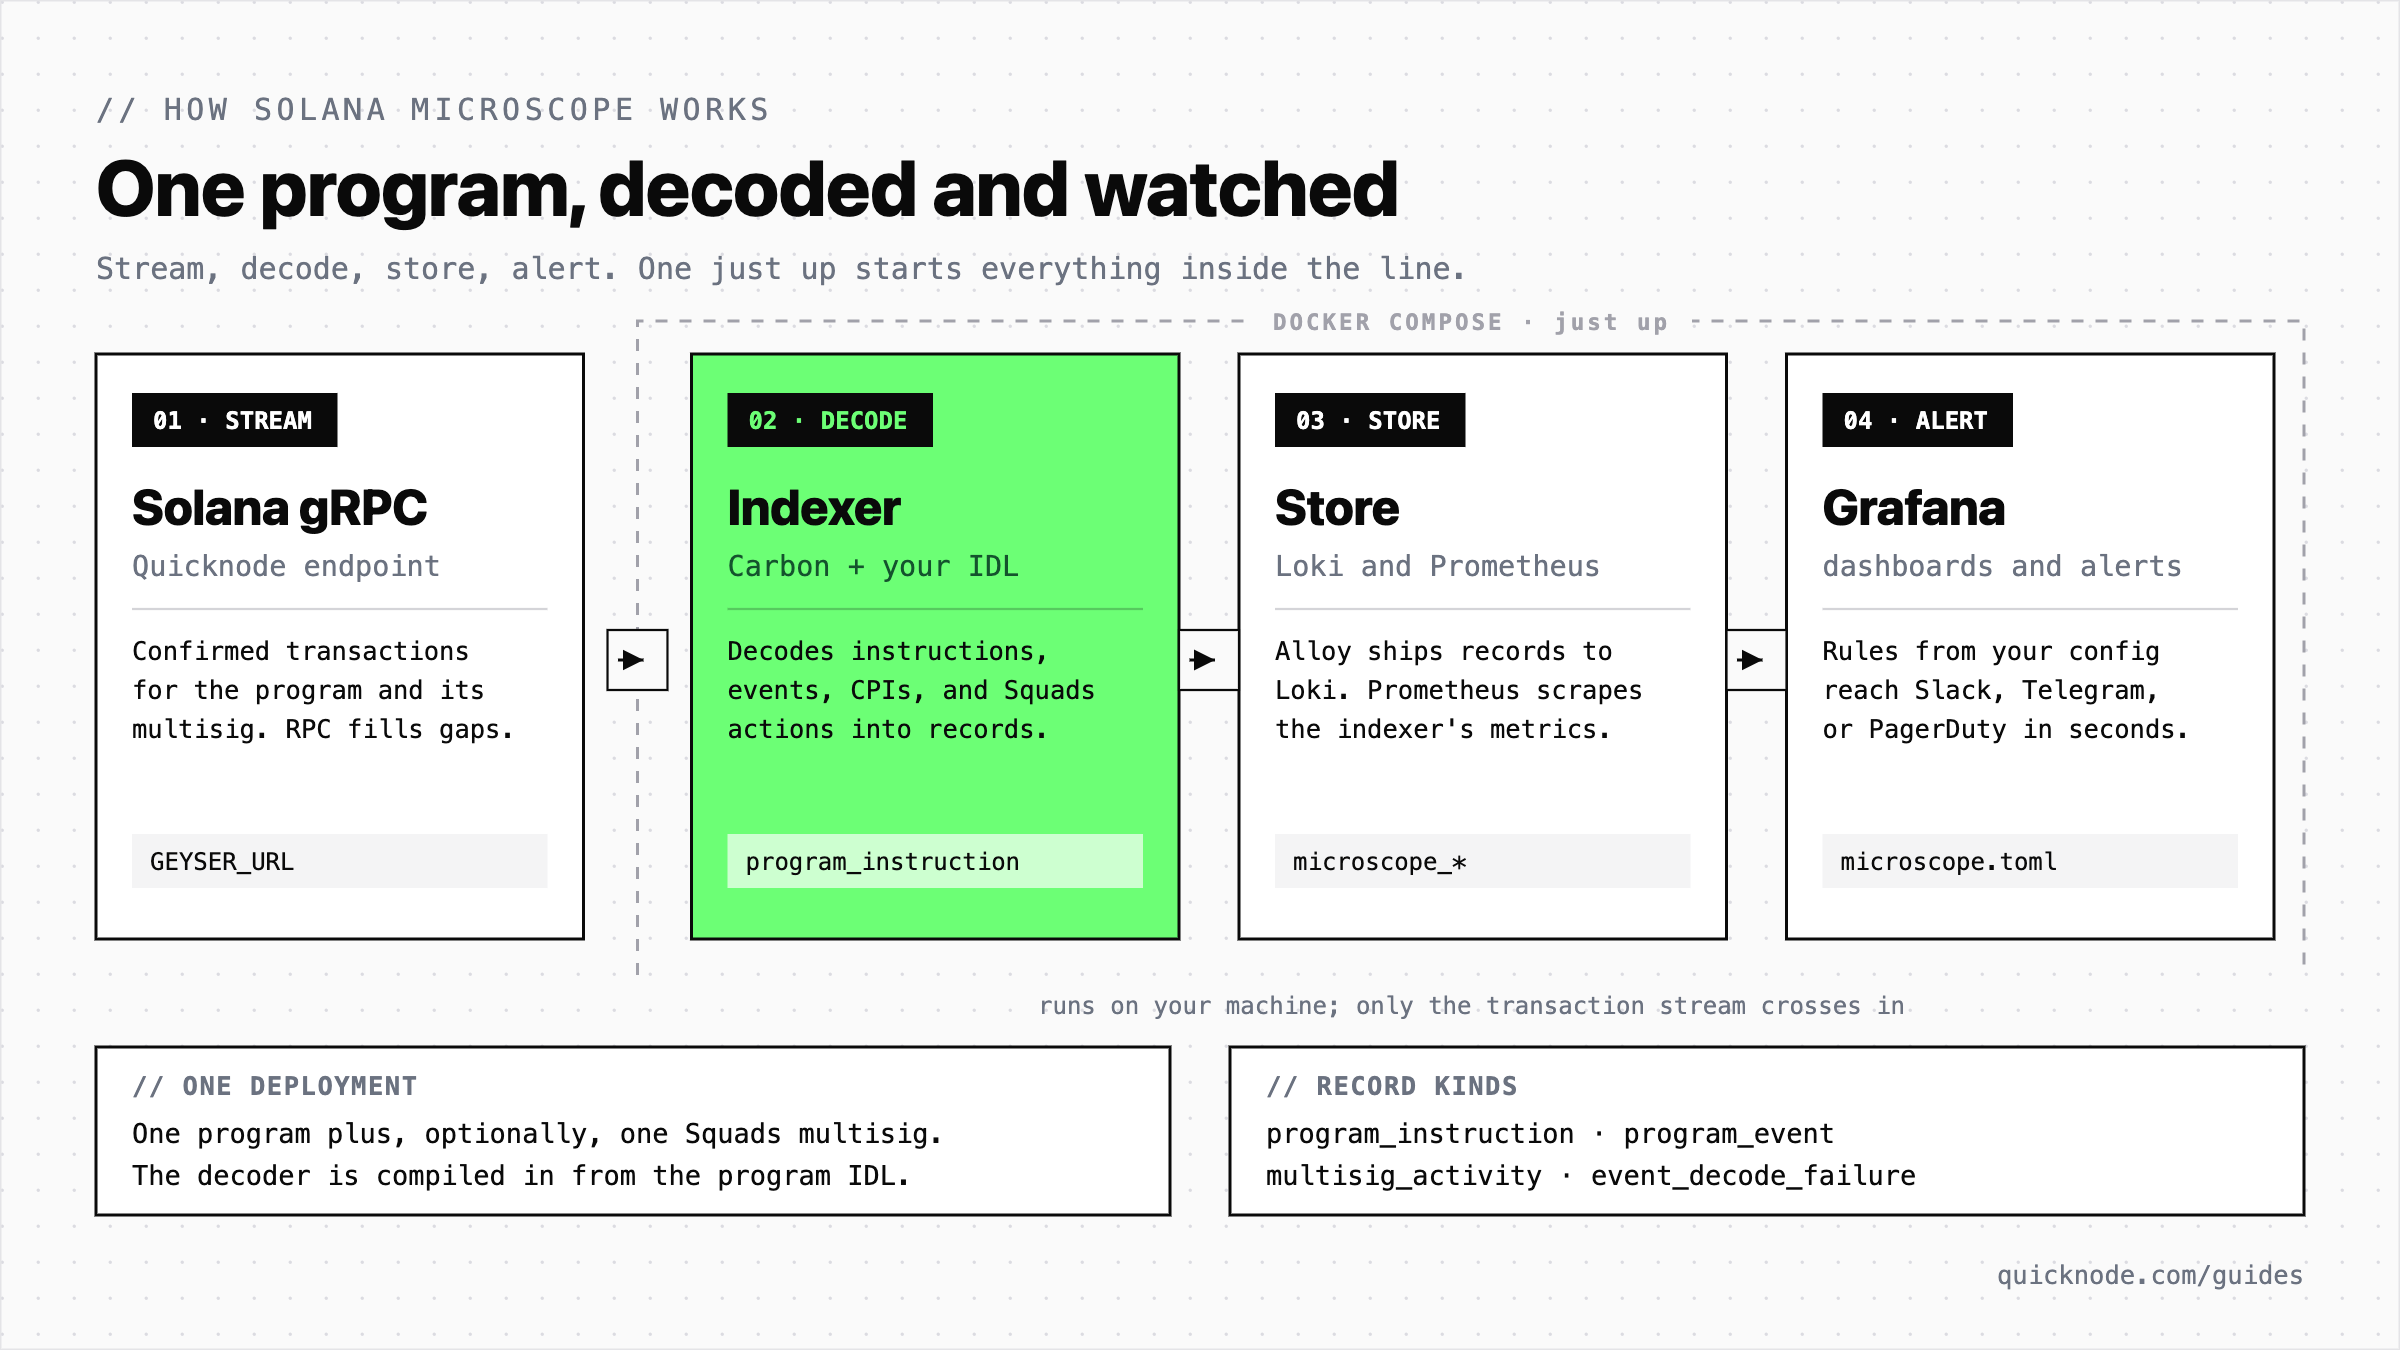
Solana Microscope streams confirmed transactions from Solana gRPC, decodes the ones that touch a single program with Carbon and the program's IDL, and writes each decoded instruction, event, or multisig action as a JSON record. Loki and Prometheus store the output, and Grafana turns it into dashboards and alerts, all running in Docker Compose from one config file.
Every record has one of four kinds:
| Record kind | Produced by |
|---|---|
program_instruction | An instruction decoded against the IDL, including instructions reached through a CPI |
program_event | An event decoded against the IDL, from program logs or an event CPI |
multisig_activity | A Squads v3, v4, or v5 instruction normalized to an action such as proposal_created |
event_decode_failure | An event payload that matched an event shape but failed to decode |
One deployment monitors one program and, optionally, one Squads multisig. The decoder is generated from the program's IDL and compiled into the indexer, so the program ID and IDL are build inputs. The indexer refuses to start if the config names a different program than the one it was built for.
Jupiter Lend makes a good teaching target. Its Anchor IDL is public, its traffic is steady but low enough to read, and its upgrade authority is a Squads v4 vault, so one deployment exercises every record kind.
What Can Solana Microscope Warn You About?
Solana Microscope can warn you about five kinds of activity on a program, each mapped to specific instructions, events, or Squads actions in the program's IDL:
- Control changes
- Economic parameter changes
- Multisig governance, such as upgrade proposals
- Unusually large flows
- Program drift
Here's how the five groups look on Jupiter Lend:
Control changes come first. update_authority and update_auths change who can administer the lending program. Instruction alerts include failed transactions unless you filter them out, so these rules also catch someone trying a privileged call without the authority.
Economic parameter changes alter what depositors and borrowers get. On the lending program, that's set_rewards_rate_model. The Borrow side is a separate program, where update_collateral_factor, update_liquidation_threshold, and update_liquidation_penalty change the risk terms of every loan. Watching those takes a second deployment pointed at the Borrow program.
Governance activity is how an upgrade happens. The program's upgrade authority is a Squads v4 vault, so replacing its code takes a proposal_created, one or more proposal_approved, and a transaction_executed on the multisig. Alerting on proposal_created gives you the whole approval period to react.
The Squads v4 actions most worth an alert:
| Action | What happened |
|---|---|
proposal_created | A member proposed a transaction, such as a program upgrade. The earliest warning you get. |
proposal_approved | A member signed. Once approvals reach the threshold, the proposal can execute. |
transaction_executed | The vault ran the approved transaction. For an upgrade proposal, the new code is live. |
configuration_transaction_created | A proposal to change members, the threshold, or the time lock. Its data holds the proposed change. |
time_lock_changed | The delay between approval and execution changed. |
spending_limit_added | Someone can now move vault funds without a full vote. |
For unusual flows, write a conditional rule on a decoded field. A rule on log_withdraw that checks whether data.assets crosses a threshold flags large withdrawals without paging on every transaction.
Program drift shows up as decode failures. An event_decode_failure record means an event payload stopped matching the IDL, which is an early sign the program was upgraded underneath your copy of it.
Because one deployment watches both the program and the multisig that controls it, a privileged call and the proposal that authorized it land in the same dashboard, seconds apart.
In v4, changes to the multisig's own members or threshold don't emit member_added or threshold_changed; they surface in configuration_transaction_created, whose record holds the proposed change.
Set Up Quicknode Solana gRPC
Microscope reads from two endpoints. Solana gRPC (Yellowstone-compatible Geyser gRPC) is the live stream, which delivers transactions as they confirm. RPC fills in behind it. When the stream can't replay through a restart or a long disconnect, the indexer recovers the missed transactions over RPC, and just backfill loads history through it. The endpoint's history depth sets how long an outage recovery can survive.
A single Quicknode Solana Mainnet endpoint provides both. Sign up for an account. Solana gRPC is included with the Scale plan and up.
Create an endpoint, select Solana and Mainnet, and copy its HTTP Provider URL:
https://<endpoint-name>.solana-mainnet.quiknode.pro/<token>/
Fill in .env from that URL. You'll save this file in the repository root after cloning it in the next section:
GEYSER_URL=https://<endpoint-name>.solana-mainnet.quiknode.pro:443
GEYSER_X_TOKEN=<token>
RPC_URL=https://<endpoint-name>.solana-mainnet.quiknode.pro/<token>/
GRAFANA_ADMIN_PASSWORD=<a strong password>
GEYSER_URL is the endpoint host on port 443, GEYSER_X_TOKEN is the token from the URL path, and RPC_URL is the full HTTP Provider URL.
Without Solana gRPC, leave GEYSER_URL and GEYSER_X_TOKEN empty and add a [datasource] section with mode = "rpc" to microscope.toml. Microscope then polls RPC_URL instead of streaming. Public RPC nodes are rate-limited below what continuous polling needs, so use your Quicknode endpoint's HTTP Provider URL for RPC_URL here too.
Configure Microscope for Jupiter Lend
Clone the repository at the commit this guide uses, copy the Jupiter Lend example config to the root, and save your .env there:
git clone https://github.com/solana-foundation/solana-microscope.git
cd solana-microscope
cp examples/jupiter-lend/microscope.toml microscope.toml
The example config already has everything set for Jupiter Lend:
program_id = "jup3YeL8QhtSx1e253b2FDvsMNC87fDrgQZivbrndc9"
idl_path = "examples/jupiter-lend/lending.json"

[multisig]
vault_address = "4MsgBB5VPoTrUSp5XnfbViV386C1UnsTdifLBw33ZMSJ"
state_address = "J3mJ3wz6xkVUk3T8qHnuAYNxsRH3ixHsryYNZAU2vG8P"
version = "v4"

[dashboard]
event_fields = ["name", "signature", "slot", "failed", "data.assets"]
multisig_fields = ["action", "squads_version", "instruction", "signature", "slot", "failed"]
program_id and idl_path name the lending (Earn) program and a vendored copy of its Anchor IDL.
[multisig] names the Squads v4 vault that holds the upgrade authority and its internal state account, the account every Squads instruction references.
[dashboard] picks the columns for the dashboard's record tables. data.assets gives decoded amounts their own column.
Microscope names every instruction, event, and alert in snake_case, matched against the generated decoder rather than the raw IDL. The IDL's LogDeposit event is log_deposit in the config. A wrong name stops the indexer at startup and lists the valid ones.
Start the Stack and Read the Output
One command builds the indexer, generates the alert rules, and starts the stack:
just up
The first run takes several minutes while it compiles the decoder. Follow the indexer's logs:
docker compose logs --follow indexer
Before it subscribes, the indexer confirms the multisig config:
verified configured Squads v4 vault 4MsgBB5VPoTrUSp5XnfbViV386C1UnsTdifLBw33ZMSJ and state account J3mJ3wz6xkVUk3T8qHnuAYNxsRH3ixHsryYNZAU2vG8P
Jupiter Lend's traffic is low, so the first decoded records can take a minute or two. A deposit produces an instruction record and an event record:
{
  "kind": "program_instruction",
  "name": "deposit",
  "data": { "data": { "assets": 420000000 } },
  "instruction_path": "2.0",
  "signature": "46fX6TToBvj6GMZnpnhbcry9VF26a8d7hinY9g5GJWXn2dasDXkuLRimVLfMHDMjrawPzbkn9rfeHQBQzdGyWhGX",
  "slot": 447813527,
  "failed": false
}
{
  "kind": "program_event",
  "name": "log_deposit",
  "instruction": "deposit",
  "data": {
    "assets": 420000000,
    "shares_minted": 399977926,
    "sender": "Ev4gtghXTSAgzcxPzY84VKvLuWfjYYsXaDDkuPm4rbx5",
    "receiver": "Ev4gtghXTSAgzcxPzY84VKvLuWfjYYsXaDDkuPm4rbx5"
  },
  "signature": "46fX6TToBvj6GMZnpnhbcry9VF26a8d7hinY9g5GJWXn2dasDXkuLRimVLfMHDMjrawPzbkn9rfeHQBQzdGyWhGX",
  "slot": 447813527
}
An instruction_path of 2.0 means the deposit was a nested instruction, where another program called Jupiter Lend through a CPI. Most Jupiter Lend traffic arrives that way, and Microscope decodes it the same as a top-level call. The amount sits at data.data.assets in the instruction record and data.assets in the event record. Alert conditions need the exact path.
Explore the Grafana Dashboard
Open http://localhost:3000 and sign in as admin with the password you set for GRAFANA_ADMIN_PASSWORD in .env. The generated overview dashboard shows transactions per second, instructions by type, errors per second, time since the last decoded activity, Squads multisig activity, and tables of recent events and multisig records.
Errors / sec counts decoded instructions that failed onchain. That's normal for a lending program, because a withdrawal or rebalance can revert, and it doesn't mean the indexer is unhealthy. Squads multisig activity stays empty until the multisig acts.
Configure Alert Rules
The example config ends with five rules. One proves the pipeline, and four are meant to stay silent:
[[alerts]]
kind = "instruction"
name = "update_authority"
severity = "critical"
channels = []

[[alerts]]
kind = "instruction"
name = "update_auths"
severity = "critical"
channels = []

[[alerts]]
kind = "instruction"
name = "set_rewards_rate_model"
severity = "warning"
channels = []

[[alerts]]
kind = "event"
name = "log_deposit"
match = "all"
conditions = [
  { field = "data.assets", operator = "gt", value = 0 },
  { field = "failed", operator = "eq", value = false },
]
severity = "info"
channels = []

[[alerts]]
kind = "multisig"
name = "proposal_created"
severity = "warning"
channels = []
log_deposit matches every successful deposit, so it fires within a minute or two and confirms the whole path from the stream to a Grafana alert. The other four watch control changes, a parameter change, and the start of any multisig proposal. Expect weeks of silence from them. Grafana evaluates each rule every 10 seconds, so when one fires, you hear about it seconds after the transaction lands.
Each rule has the same fields:
kindisinstruction,event, ormultisig.nameis a snake_case instruction or event from the IDL, or a Squads action.severityiscritical,error,warning, orinfo.conditions(optional) check decoded fields withexists,contains,eq,ne,gt,gte,lt, orlte.match = "all"(the default) requires every condition, andmatch = "any"requires one.channelslists where to send it. An empty list evaluates the rule without notifying anyone.
A conditional rule adds decoded-field checks. This one flags large withdrawals:
[[alerts]]
kind = "event"
name = "log_withdraw"
match = "all"
conditions = [
  { field = "data.assets", operator = "gte", value = 1000000000 },
  { field = "failed", operator = "eq", value = false },
]
severity = "warning"
channels = []
Amounts are raw base units of the withdrawn token, so 1000000000 is 1,000 USDC or one SOL. Tune the threshold against the values in the dashboard. Rules for the other governance actions, such as transaction_executed and configuration_transaction_created, take the same shape as proposal_created.
Re-provision after every change to microscope.toml:
just up
Grafana loads alert rules only when it starts, so restarting Grafana alone keeps the old rules, and just up overwrites edits made in Grafana's UI. Open Alerting > Alert rules in Grafana to confirm log_deposit moves to Firing.
Connect Notification Channels
Every channel works the same way. Add its credentials to .env, add the channel name to the channels array of each alert that should notify, and rerun just up:
| Channel | .env values |
|---|---|
| Slack | SLACK_WEBHOOK_URL (an incoming webhook URL) |
| Telegram | TELEGRAM_BOT_TOKEN, TELEGRAM_CHAT_ID |
| PagerDuty | PAGERDUTY_INTEGRATION_KEY |
Route by severity. Send critical rules to PagerDuty and a team channel, and send warning and info rules to Slack or Telegram only:
[[alerts]]
kind = "instruction"
name = "update_authority"
severity = "critical"
channels = ["pagerduty", "slack"]

[[alerts]]
kind = "event"
name = "log_withdraw"
severity = "warning"
channels = ["slack"]
Microscope's built-in health alerts, which watch the stream and log delivery, go to every channel your alerts use.
Backfill History
The indexer only sees activity from the moment it starts. To fill the dashboard with the past week, run a backfill with the stack up:
just backfill 7d
Backfill doesn't use the gRPC stream. It crawls history through the Solana JSON-RPC endpoint in RPC_URL, calling getSignaturesForAddress and getTransaction, so RPC_URL must be set. The same endpoint also handles gap recovery alongside the stream and is the only datasource in mode = "rpc". Its history depth caps how far back a backfill can reach and how long an outage recovery can survive. Public endpoints are rate-limited below what this needs, so use your Quicknode endpoint's HTTP Provider URL.
Monitor Your Own Program
Pointing Microscope at your own program takes three changes in microscope.toml: program_id, idl_path, and the [multisig] section. Then rewrite the alerts against your IDL's instruction and event names, starting with whatever changes who controls the program.
Switching to Jupiter Lend Borrow shows the pattern. Download vaults.json from the jupiter-lend repository's target/idl/ directory into examples/jupiter-lend/, then change two lines:
program_id = "jupr81YtYssSyPt8jbnGuiWon5f6x9TcDEFxYe3Bdzi"
idl_path = "examples/jupiter-lend/vaults.json"
The [multisig] section stays, because the same multisig controls both programs. The alerts change to the Borrow program's risk parameters, such as update_collateral_factor and update_liquidation_threshold.
The repository also ships a setup-deployment Claude Code skill that interviews you for these values, derives alert rules from your IDL, and validates the config. To run beyond your laptop, the repository includes Terraform configurations for AWS and Google Cloud, and a mode that ships to an existing Grafana Cloud stack instead of running Grafana locally.
When you're done, stop the stack and delete its data:
docker compose down --volumes
Frequently Asked Questions
What is Solana Microscope?
Solana Microscope is an open-source, self-hosted monitoring and alerting stack for a single Solana program, maintained by the Solana Foundation. A Rust indexer consumes confirmed transactions from a Yellowstone-protocol gRPC stream or RPC polling, decodes instructions and events with Carbon using the program IDL, and exposes them through Prometheus, Loki, and Grafana. Alert rules are written in microscope.toml and delivered to Slack, Telegram, or PagerDuty. It also decodes Squads v3, v4, and v5 multisig activity.
How do I connect Solana Microscope to Quicknode?
Set GEYSER_URL to your Quicknode Solana endpoint host on port 443 (https://<endpoint-name>.solana-mainnet.quiknode.pro:443), GEYSER_X_TOKEN to the token from your endpoint URL, and RPC_URL to the full HTTP Provider URL. Microscope sends the token as the x-token metadata header that Quicknode Solana gRPC expects. Solana gRPC is included with the Scale plan and up; on other plans, set mode = "rpc" in the [datasource] section and use RPC_URL alone.
Does Solana Microscope need an IDL?
Yes. Microscope generates its decoder from the program IDL at build time, so a program without a published IDL cannot be decoded. The IDL should also declare events. Without them, Microscope can only alert on instructions and loses the decoded amounts and addresses that events carry. Anchor IDLs usually declare events; Shank IDLs usually do not.
Why did my alert change not take effect?
Grafana loads provisioned alert rules only when it starts, so you must run just up after editing microscope.toml. Restarting the Grafana container alone keeps the previous rules, and changes made in the Grafana alerting UI are overwritten the next time just up runs.
Can one Microscope deployment monitor several programs?
No. The decoder for one program is compiled into the indexer, and the indexer refuses to start if microscope.toml names a different program_id or IDL. Each deployment monitors one program plus, optionally, the Squads multisig that controls it. To monitor another program, run a second stack with its own config and a distinct COMPOSE_PROJECT_NAME.
How does Solana Microscope monitor a Squads multisig?
Add a [multisig] section to microscope.toml with the Squads vault address, the internal state account, and the version (v3, v4, or v5). Microscope ships pinned Squads IDLs, watches the state account, and normalizes each Squads instruction into an action such as proposal_created, proposal_approved, transaction_executed, or configuration_transaction_created. A program upgrade through the multisig appears as that sequence of actions, so alerting on proposal_created warns you before the upgrade can execute.
Wrapping Up
You connected Solana Microscope to a Quicknode Solana gRPC endpoint, watched live Jupiter Lend deposits turn into decoded records, and read them in a generated Grafana dashboard. You configured alerts on the program's privileged calls and on the multisig that can upgrade it, added a conditional rule for large withdrawals, and routed them to a notification channel. The same setup works for your own program, or for any protocol you've integrated with, so the next authority change or upgrade proposal reaches you in seconds instead of from a user's DM the next morning.