Announcing Logs: A Powerful Debugging Tool
Announcing Logs: A Powerful Debugging Tool
Logs are now available in the Quicknode Dev Portal behind the Logs tab in your endpoint, which simplifies debugging and reduces reliance on support.

January 30, 2025 — 2 min read
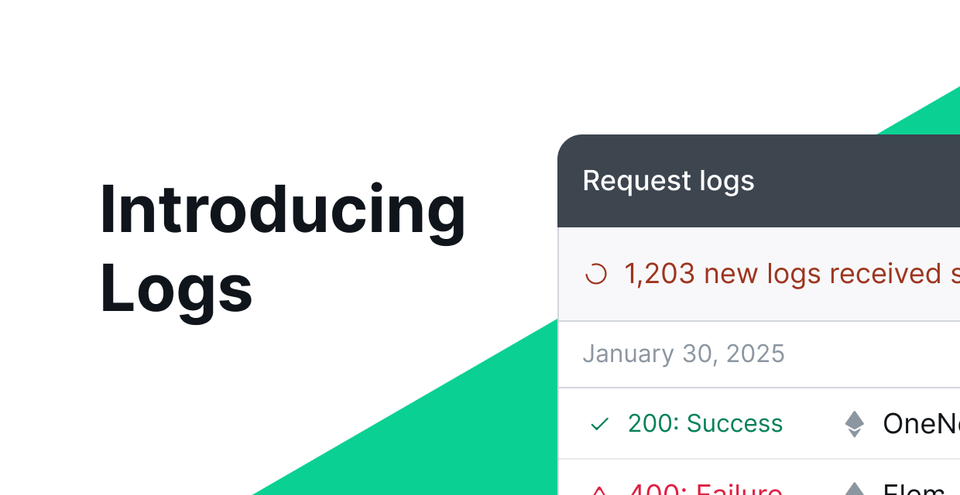
Your dApp development just got a whole lot easier with the new Logs feature, designed to enhance visibility into transactions and errors occurring on your RPC endpoints through response logging.
This tool, now available in the Quicknode Dashboard behind the Logs tab in your endpoint, simplifies debugging and reduces reliance on support.
By offering detailed insights into requests and responses, logs enable developers to identify and resolve issues quickly and with less guesswork, ensuring smoother operations and improved performance.
Keep reading to learn more about logs, and check out further details on using logs in our developer docs.
Fewer Headaches, Greater Visibility
Troubleshooting where your code went wrong can be the most significant time sink in any developer's workflow. Any tool that speeds along your process means more productivity, a faster time to market, and an error-free dApp from day one.
Logs will help you significantly improve your debugging process with clear insights into your send transactions and RPC errors, including failed transactions and misconfigured parameters. You’ll also gain enhanced visibility with a transparent view of your RPC requests and responses–minimizing guesswork.
Everything You Get When You Turn on Logging Activation
At launch, logs will help you pinpoint where and why your code didn’t work. Here are a few features that will accelerate your debugging workflow.
Detailed Logs: View information about RPC requests, including request and response data, status codes, and methods used.
Time-Based Filtering: Depending on your plan, you can filter logs by time frames such as the last 15 minutes, hour, day, or up to 14 days.
Privacy Protections: Sensitive data is not logged or displayed for select accounts, ensuring privacy.
仕組み
Filtering Options: Logs can be filtered by time frame, endpoint, chain, method, or status code for streamlined debugging.
Multi-chain: If your endpoint is enabled for multi-chain, you can browse your requests by chain.
Log Access by Plan
Logs will be available to customers on our new paid plans, with longer cached logs the higher your plan. Customers on legacy plans will need to switch to the newer plans to gain access. Read below to get a detailed view of what type of log access you get plan by plan.
Tier | Log Access |
|---|---|
無料 | 該当なし |
ビルド | Logs from the last hour |
高速化 | Logs from the last day |
Chainlink | Logs from the last day |
ビジネス | Logs from the last day |
Check out further details on activating and using logs in our developer docs.
Quicknodeについて
2017年に設立されたQuicknode は、開発者 および企業向けに、機関投資家レベルのブロックチェーン インフラストラクチャを提供しています。99.99%の稼働率と、80以上のチェーンに対応したサポート を備え、チーム は妥協のないオンチェーン アプリケーションの構築とスケーリングを実現します。
最新情報を入手する
最新のエンジニアリングに関する知見、製品の最新情報、Web3のニュースを、メールボックスに直接お届けします。