Phoenix Perps Dashboard
A real-time SOL perpetual futures dashboard built with React and TypeScript, powered by Phoenix's public REST and WebSocket API. No API key required.



概要
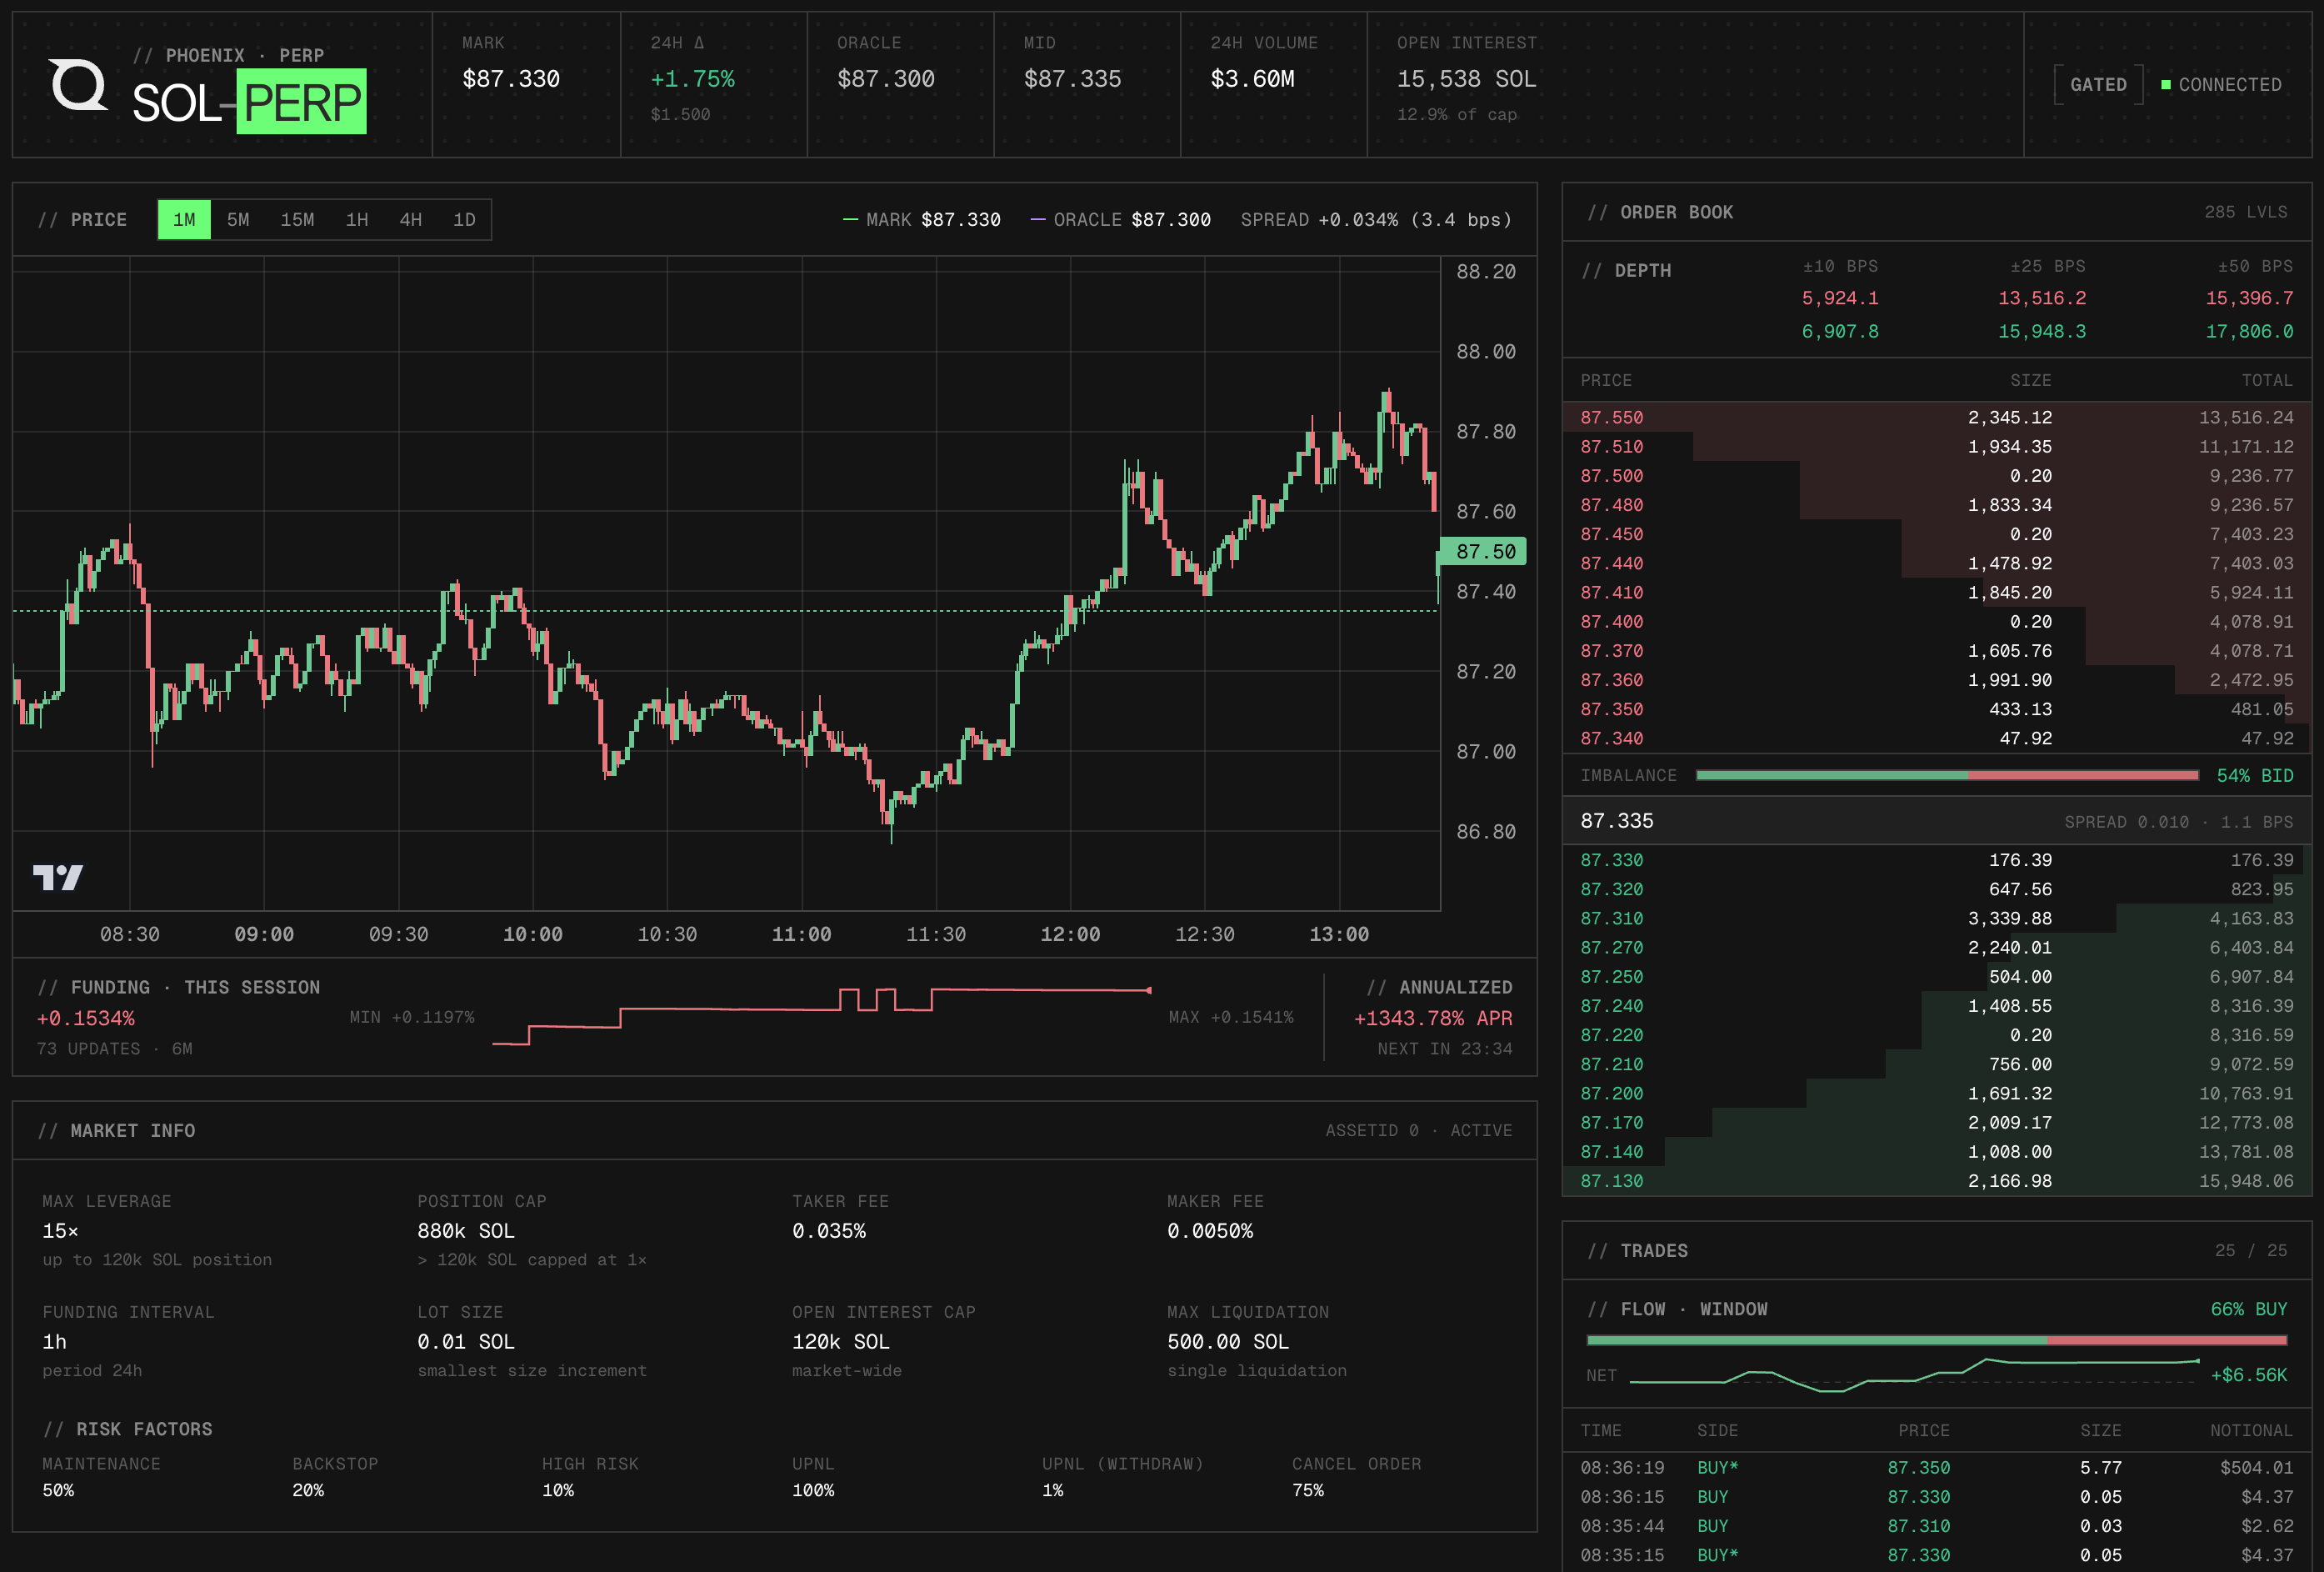
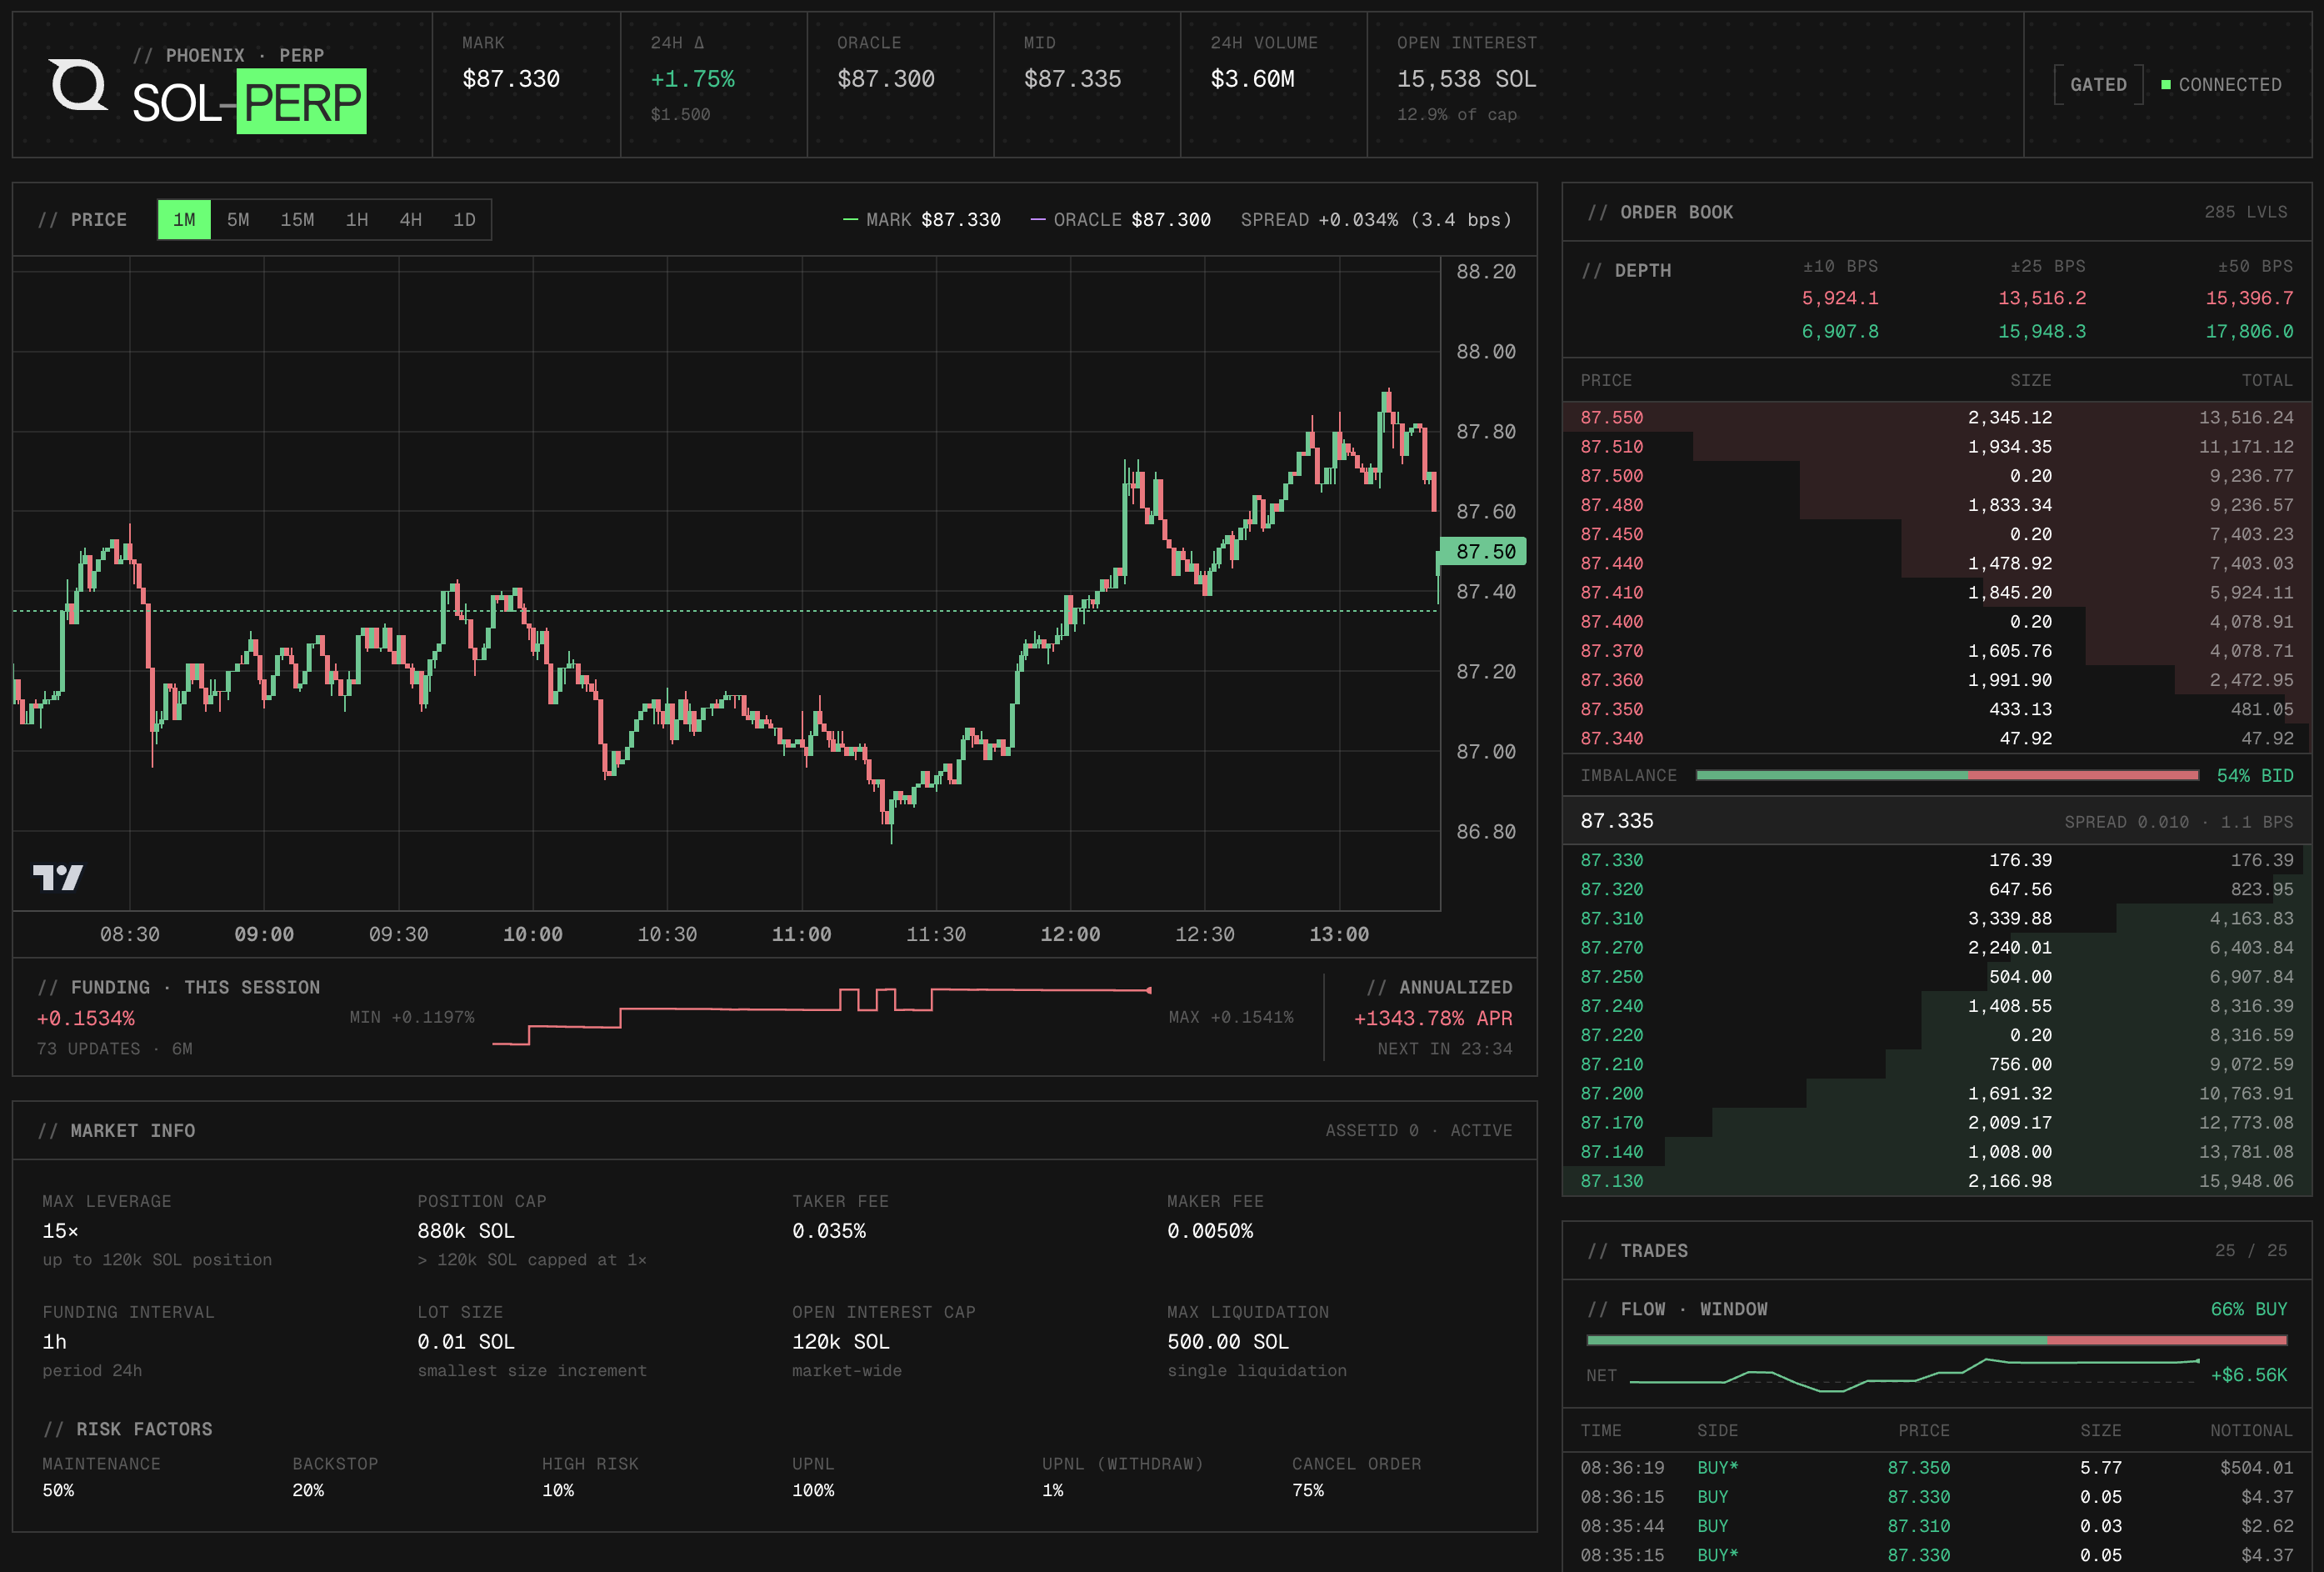
Phoenix is a Solana-native perpetuals exchange. This dashboard demonstrates how to build a live SOL-PERP market terminal using Phoenix's public REST and WebSocket API covering the full data pipeline: seeding historical candles and static market config via REST, subscribing to six real-time channels over a single shared WebSocket connection, and rendering an interactive candlestick chart alongside a live orderbook, trade feed, and funding strip.
No API key, signed headers, or wallet connection is required. All data comes from Phoenix's public perp-api.phoenix.trade endpoints. To extend the dashboard with onchain reads (transaction history, account state), connect a Quicknode Solana RPC endpoint.
The full guide covering this dashboard's architecture is available at Build a Real-Time SOL Perps Dashboard with the Phoenix API.
建築
Phoenix REST API (https://perp-api.phoenix.trade)
  → App.tsx seeds on mount: historical candles + static market config

Phoenix WebSocket (wss://perp-api.phoenix.trade/v1/ws)
  → PhoenixWebSocket.tsx manages one shared connection
      → market channel      → MarketOverview (header stats)
      → fundingRate channel → MarketOverview + funding strip
      → candles channel     → PriceChart (OHLCV + overlays)
      → orderbook channel   → Orderbook (top bid/ask levels)
      → trades channel      → TradeFeed (recent fills)
      → exchange channel    → ConnectionStatus badge
  REST only → MarketInfo (fees, leverage tiers, tick/lot size)
特長
- Live mark price, oracle price, 24h change, 24h volume, open interest, and funding rate in a sticky header bar
- Candlestick chart with mark price (green) and oracle price (purple dashed) overlays; spread highlighted red when it exceeds 10 bps
- Six timeframes (1m, 5m, 15m, 1h, 4h, 1d) — switching re-seeds candles from REST immediately
- Real-time L2 orderbook showing top bid and ask levels with cumulative size and spread
- Live trade feed showing the 25 most recent fills with side, price, size, and notional value
- Funding strip below the chart tracking session-local rate history, annualized APR, and countdown to next settlement
- Static market info panel with fees, max leverage, tier table, and margin requirements
- WebSocket reconnection with exponential backoff (up to 15 seconds)
前提条件
- Node.js 20+
- npm or pnpm
Project Structure
src/
├── api.ts                          # REST helpers (candles, market config)
├── types.ts                        # Shared TypeScript types
├── App.tsx                         # Root component; seeds REST data on mount
├── ws/
│   └── PhoenixWebSocket.tsx        # WebSocket provider + React context
├── components/
│   ├── ConnectionStatus.tsx        # WS connection state indicator
│   ├── MarketInfo.tsx              # Market config panel (fees, leverage, funding)
│   ├── MarketOverview.tsx          # Header stats bar
│   ├── Orderbook.tsx               # Live bid/ask depth table
│   ├── PriceChart.tsx              # Candlestick chart with funding strip
│   └── TradeFeed.tsx               # Recent trade prints
└── utils/
    ├── format.ts                   # Number formatting helpers
    └── useFundingCountdown.ts      # Countdown hook for next funding settlement
はじめに
1. Clone the repo
git clone https://github.com/quiknode-labs/qn-guide-examples.git
cd qn-guide-examples/solana/phoenix-dashboard
2. Install dependencies
npm install
3. Start the development server
npm run dev
Open http://localhost:5173 in your browser. The dashboard will connect to Phoenix and begin streaming live data immediately.
No environment variables are required. The dashboard connects directly to Phoenix's public REST and WebSocket endpoints.
プレビュー
- リポジトリをフォークする
- フィーチャーブランチを作成する:git checkout -b feature/amazing-feature
- 変更をコミットします:git commit -m "素晴らしい機能を追加"
- ブランチをプッシュしてください:git push origin feature/amazing-feature
- プルリクエストを作成してください。