
12 min read
Overview
If you've been building applications that interact with the blockchain, you've probably wondered which RPC provider gives you the best performance. In this guide, we'll demonstrate how to test RPC providers and also go over fundamental concepts to understand to better understand RPC requests. By the end of the guide, you'll be able to run experiments on different RPC providers to see which one delivers the best performance and better understand how to compare different providers.
What You Will Learn
- Why comparing block height alone can be misleading
- How to build a testing suite to evaluate RPC providers
- What data freshness is and why it matters more than simple metrics
- How to implement a data freshness scoring system
- Techniques to optimize your RPC usage
What You Will Need
- Basic understanding of blockchain RPC providers
- Node.js installed on your machine
- At least two RPC provider URLs to compare
Analyzing Block Height
You're comparing RPC providers for your application. One provider consistently returns block heights 3-4 blocks ahead of the competition. Another responds in 50ms while the "better" one takes 400ms. Which one should you choose?
If you picked the provider returning the higher block number at the time, you'd be making a mistake. The provider that appears to give you the freshest data might actually be serving you information that's less useful for your application.
This isn't obvious. It requires understanding what actually happens during an RPC request and how that timing affects the data you receive. Let's investigate why in this case a "slower" provider delivered more useful data.
Comparing RPC Provider Metrics
When evaluating RPC providers, there are two metrics that can be useful in making performance comparisons:
- Block height - Which provider returns the highest block number? Higher is better, right? You want the most current view of the blockchain
- Response time - How fast do you get the data? Lower latency means your application can react faster
Both metrics are important. The problem is when they conflict.
RPC Provider Analysis
Let's look at real data from two Arbitrum RPC providers tested over one hour. We made ~60 concurrent requests to each provider during a period when Arbitrum produced ~14,400 blocks.
Arbitrum creates a new block roughly every 250 milliseconds, about 4 times per second. Keep that number in mind.
Block Height Results
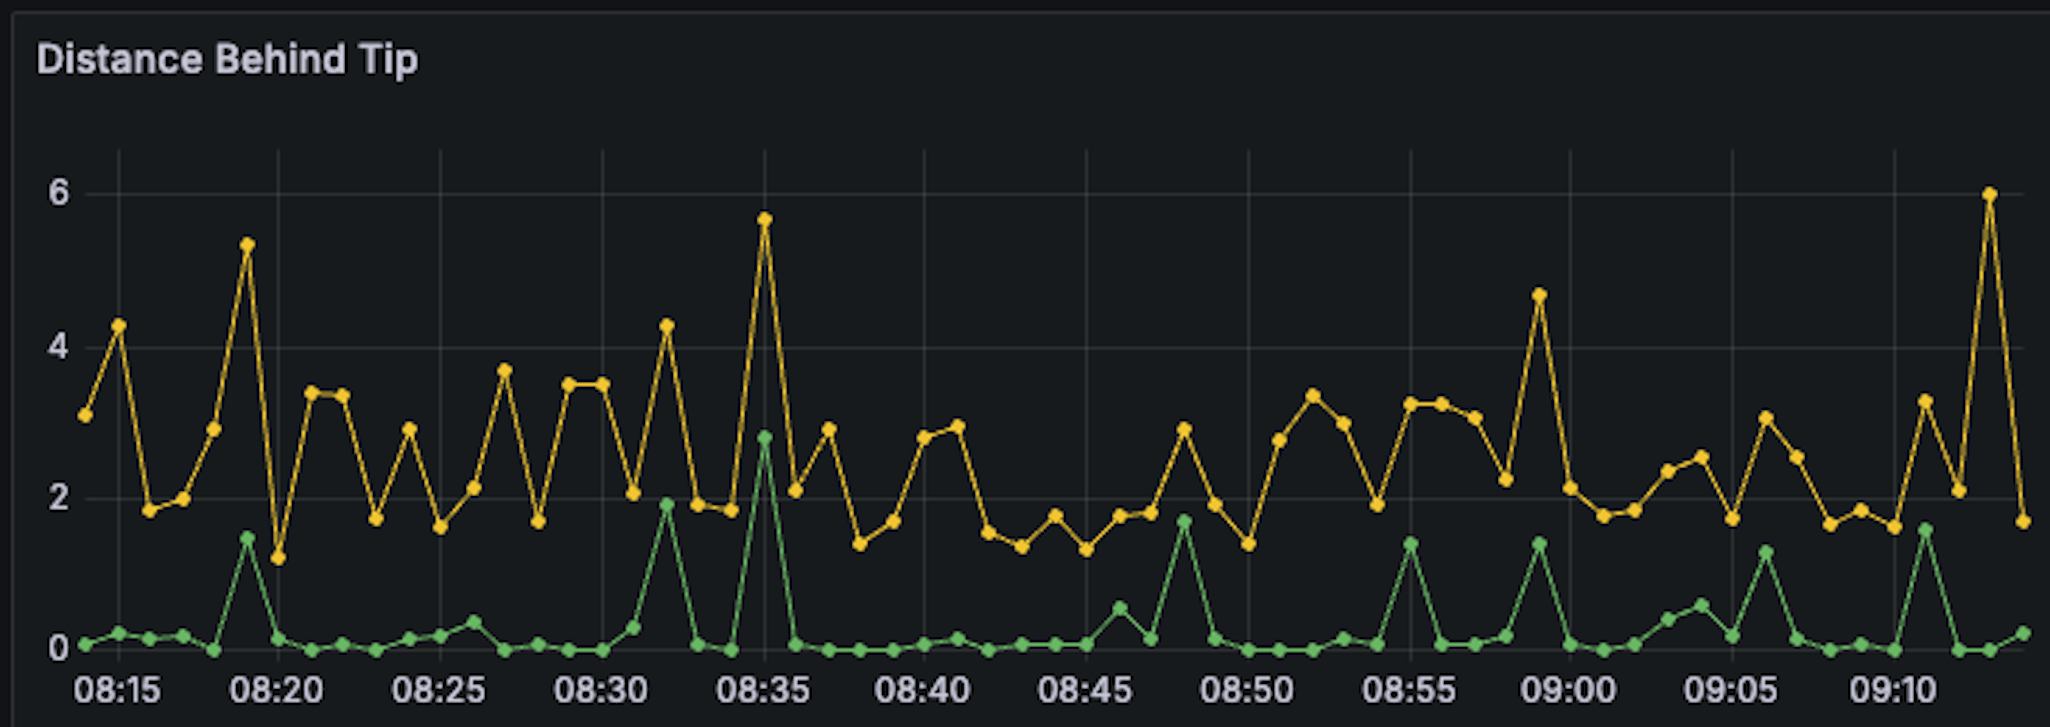
Green consistently returned block numbers 2-4 blocks ahead of Yellow throughout the entire test. If we stopped the analysis here, Green looks like the clear winner.
Response Time Results
Now, let’s take a look at the response times of each provider.
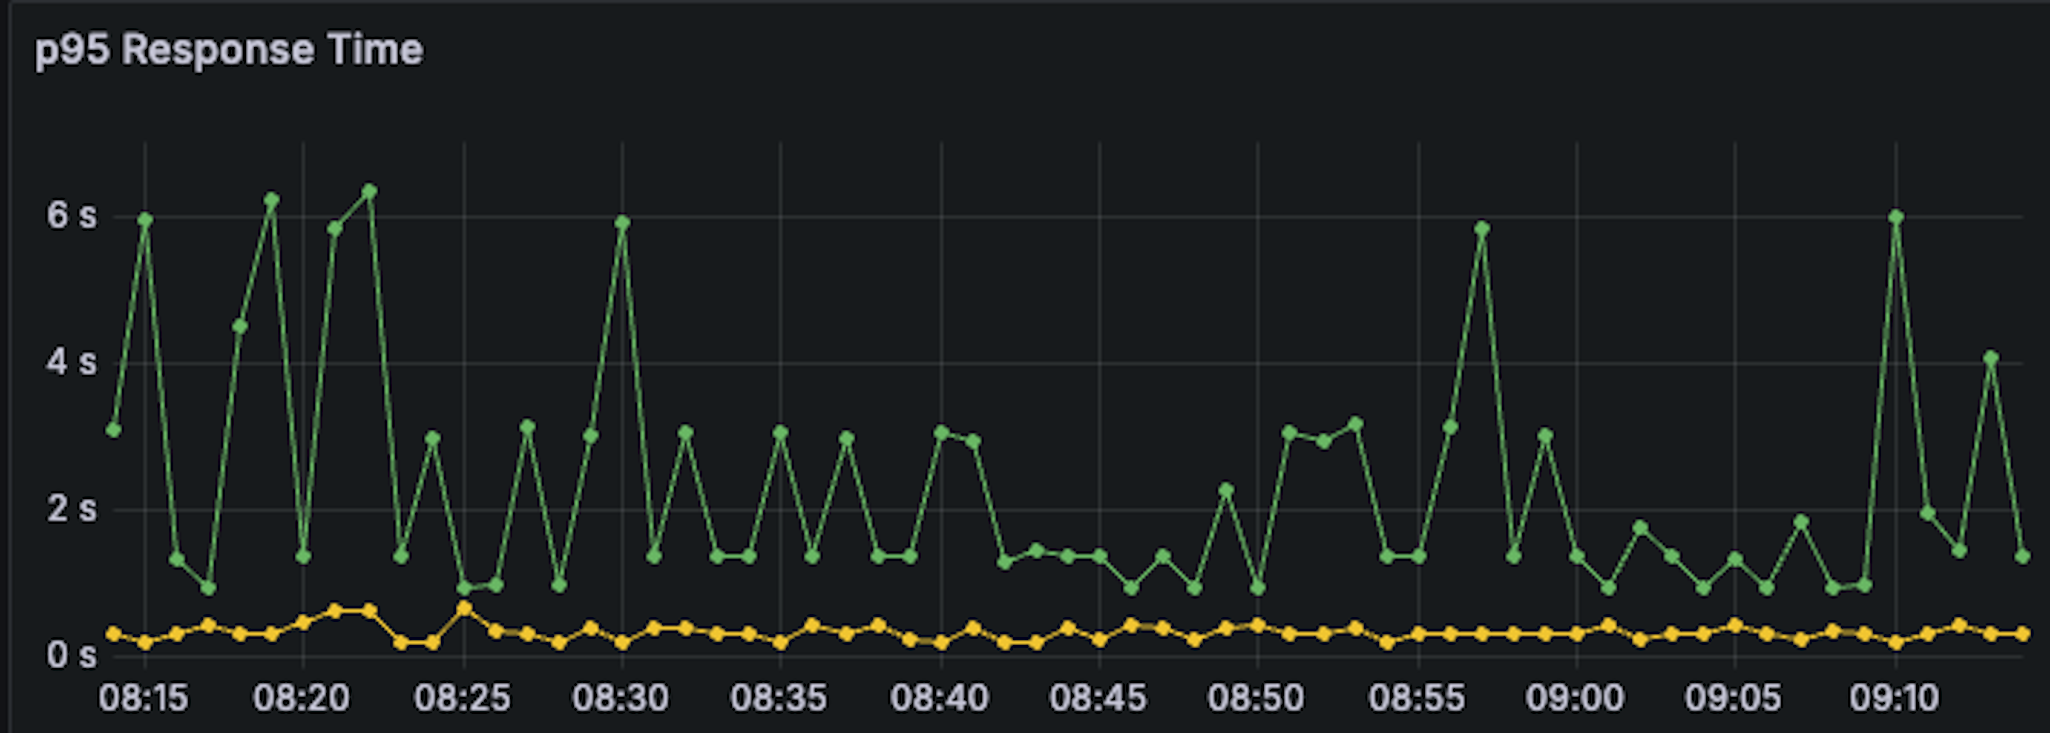
The Green provider gave the newest block data, but its response times were slow and inconsistent (sometimes fast), sometimes taking up to 6 seconds. The Yellow provider wasn’t as up to date, but it was much faster, usually around 200–400ms.
Depending on what your app needs, you might choose differently. If getting the latest data is most important, you might still prefer the Yellow provider.
These results show the p95 response time, meaning only the slowest 5% of requests were that slow. Let’s check the median time next to see the typical speed.
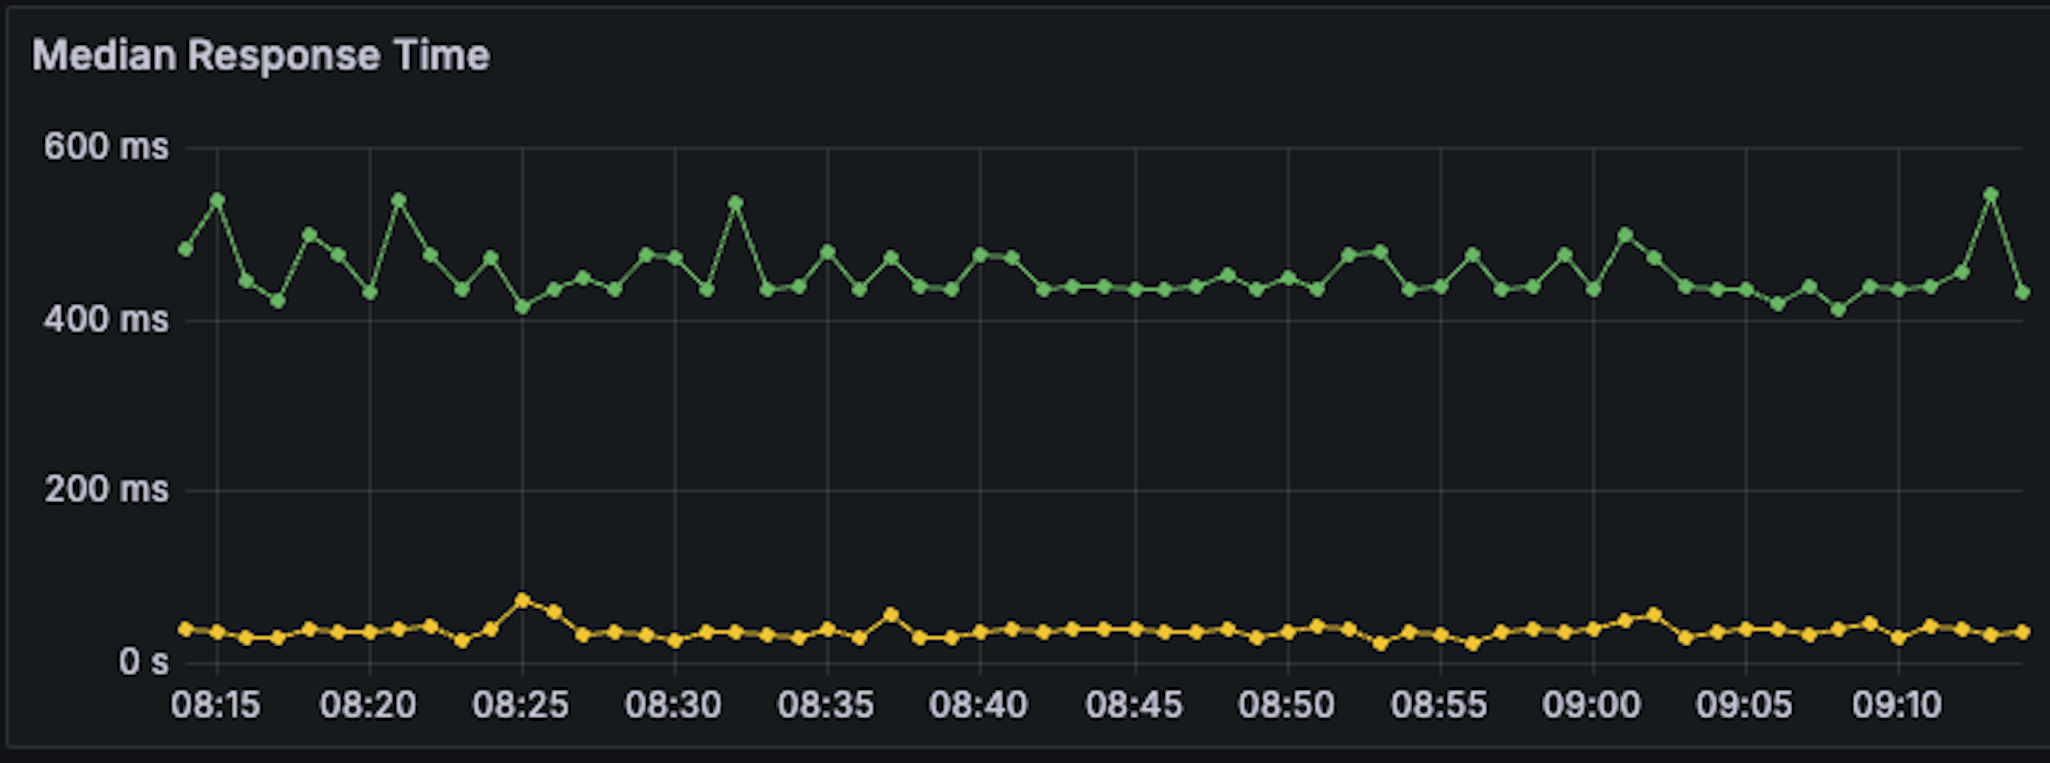
Yellow delivers responses in 40-50ms at the median. Green takes 200-400ms. That's a 5-10x difference in speed.
Now we have conflicting signals:
- Green gives you higher block numbers (newer data)
- Yellow gives you faster responses (quicker access)
So which provider actually gives you fresher data? We'll find out soon.
Understanding the Request Lifecycle
When your application makes an RPC request, several steps occur before you receive the data:
- DNS Resolution: Finding the provider's server
- TCP Connection: Establishing a network connection
- TLS Handshake: Setting up secure communication
- Request Processing: The provider retrieves data from its nodes
- Time to First Byte (TTFB): First response data begins arriving
- Download Completion: Full response is received
Here's the insight: The blockchain state is captured by the provider during step 4, after the TLS handshake completes but before the first byte is sent back to you. The state you receive reflects the blockchain at that specific moment, not when you made the request or when you finished downloading the response.
Response Time Breakdown
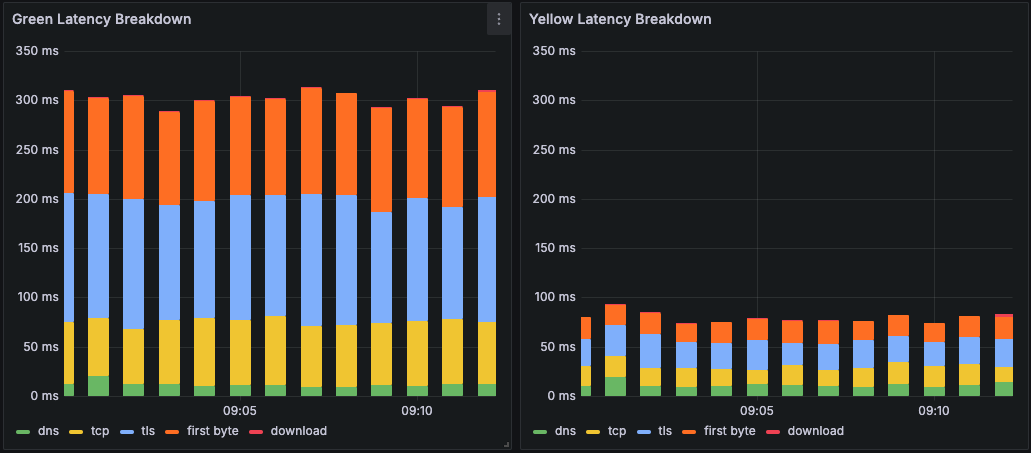
Now let's look at the breakdown of time spent on each step of the request lifecycle for both providers. Green provider is on the left, Yellow on the right:
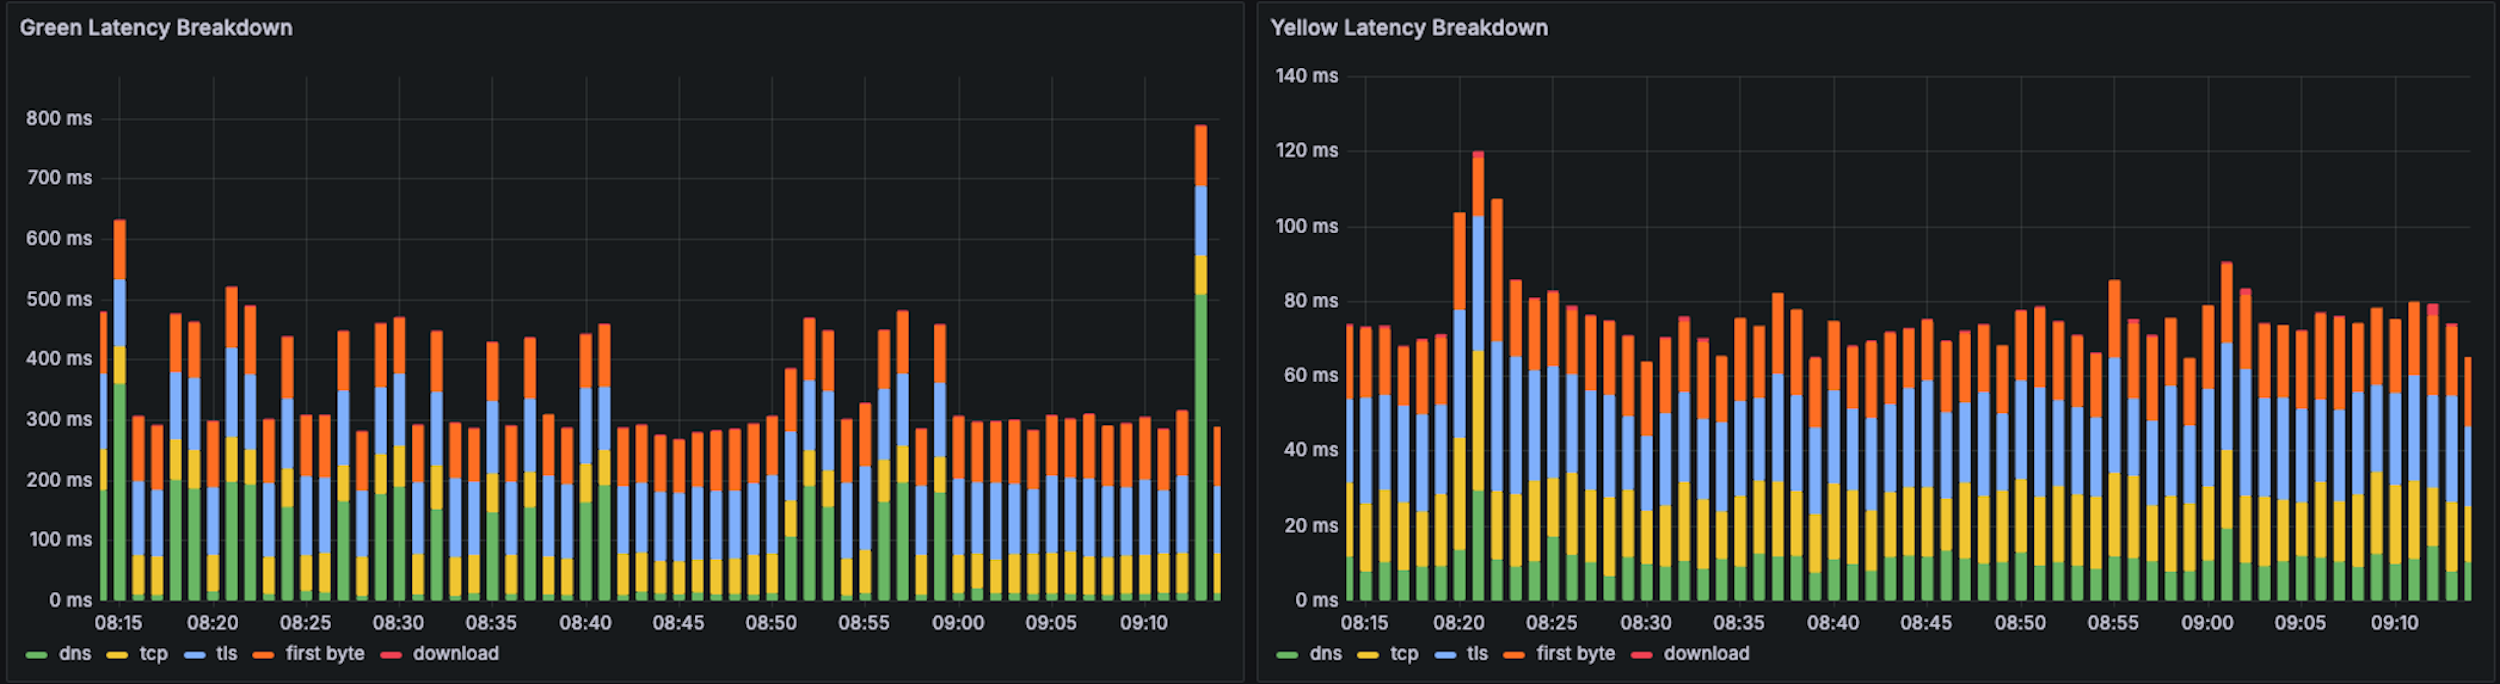
Notice that the request lifecycle flows from bottom to top: DNS → TCP → TLS → First Byte → Download Time. These all add up to the total response time.
Look at what's happening, the Green provider takes around 200ms just to complete the TLS handshake, before it even starts looking for the current block height. Meanwhile, the Yellow provider completes its entire request in less than 100ms.
This means:
- By the time Yellow has delivered its response to you, Green hasn't even started "looking" for the latest block height yet
- When Green finally does capture the blockchain state, Arbitrum has likely already produced the next block (remember, blocks come every ~250ms)
- Yellow could have fulfilled 3 requests and returned 3 different sequential block heights in the time it takes Green to complete one request
Let's zoom in to see this more clearly:
This reveals the paradox: Although Green returns a higher block number, it doesn't accurately represent the blockchain state at the moment you made your request. By the time the data reaches you, it's already outdated relative to when you asked for it.
This reveals three problems with Green's approach. First, its lag means you're skipping blocks if your application needs information from block N, but Green jumps from N-1 to N+2, you've lost that data. Second, even though the block number is higher, the data may already be stale by the time you receive it. Third, your application operates under the assumption that the data represents "now", but the network has already moved on.
By delivering data more quickly relative to when it was requested, Yellow provides data that's more useful for real-time applications. The data more accurately reflects the network state at the moment you asked for it.
What is Data Freshness?
This brings us to the concept of data freshness a metric that captures what really matters when evaluating RPC providers.
Data freshness is how quickly new blockchain state is made available by an RPC provider. It's not just about getting the highest block number, and it's not just about fast response times. It's about the relationship between:
- How quickly you receive data after making a request
- How current the block state was when captured by the RPC provider
- The performance of the RPC provider relative to the blockchain's block production rate
- How quickly the provider is able to obtain and provide the latest state of the blockchain
This is critical for high-throughput blockchains like Arbitrum, Solana, and Base where blocks are produced very quickly. When block time is 250ms but your response time is 500ms, you're fundamentally unable to keep up with the blockchain in real-time. In the time it takes to get one response, two blocks have been created meaning you're constantly falling behind and missing data.
Measuring Data Freshness with a Score
To quantify data freshness, we can create a "Latency Freshness Score" that compares response time to the blockchain's average block time:
Freshness Score = 1 - (latency / avgBlockTime)
The formula gives you a normalized score between 1.0 (instant response, e.g., theoretical maximum) and negative values (slower than block production). A score of 0 means your response time exactly matches the average block time.
What does this mean practically? If your score is above 0, you're fetching blocks faster than they're produced and you have time to process each one before the next arrives. The higher the score, the more breathing room you have. At exactly 0, you're just barely keeping up with no time to spare. Below 0, you're fundamentally falling behind the blockchain produces blocks faster than you can retrieve them.
Now let's apply this freshness score to our Green vs Yellow comparison using median latency:
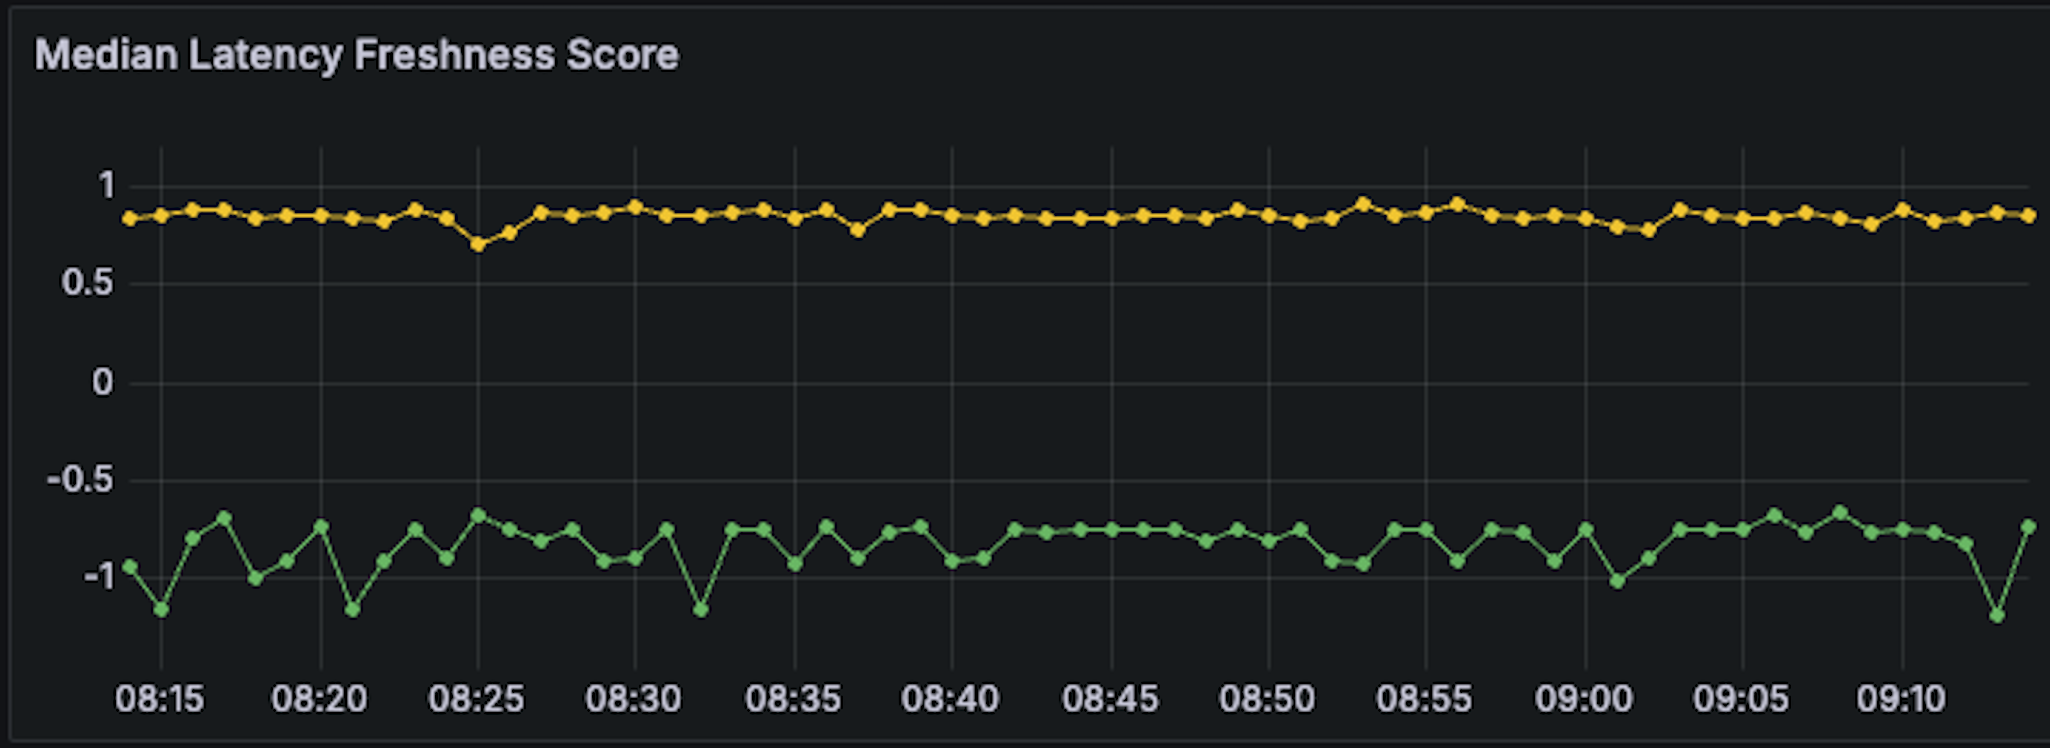
The difference is:
- Green provider: Score never rose above 0, meaning it consistently served responses slower than Arbitrum produced blocks. It even dipped below -1, indicating it was twice as slow as the rate of new block production.
- Yellow provider: Maintained a consistently high score around 0.8, meaning it delivered data with significant time to spare before the next block. Your application can actually process the data and make decisions before the blockchain moves on.
When we calculate the freshness score using p95 latency (accounting for the slower outlier requests), the picture becomes even clearer:
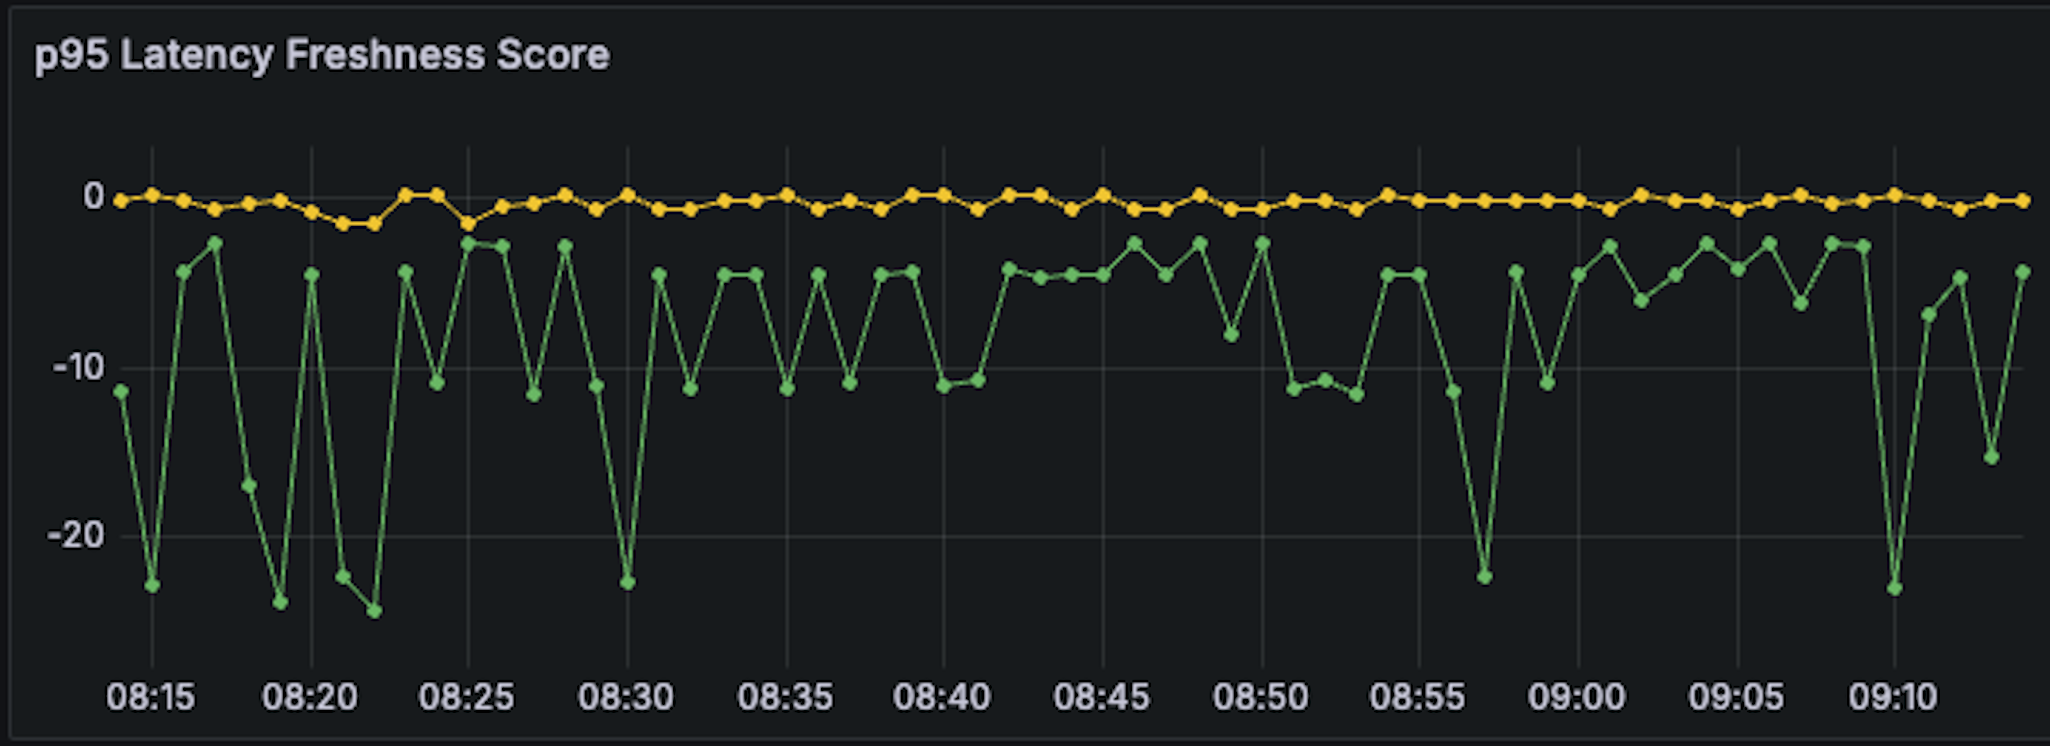
Both providers show worse performance at p95, but Green's negative score is far more pronounced. Even Yellow dips below -1 for its slowest requests, showing that even the faster provider can struggle during network congestion or high load.
The verdict: Yellow returned lower block numbers precisely because it was serving data more quickly and freshly capturing the blockchain state earlier in the request lifecycle. Meanwhile, Green returned higher block numbers because it took so long to complete the connection setup (TLS handshake, etc.) that by the time it finally captured the blockchain state, several more blocks had already been produced. Despite the higher block numbers, Yellow is objectively the better provider for applications that need real-time data. It delivers data that accurately represents the blockchain state when you requested it, and does so fast enough that your application can keep pace with block production.
Building Your Own Testing Suite
Now let's build a tool to test and compare RPC providers yourself. We'll create a script that measures response times, block heights, and calculates freshness scores.
Setting Up the Project
First, create a new Node.js project and install the required dependencies:
mkdir rpc-comparison
cd rpc-comparison
npm init -y
npm install ethers
Creating the Test Script
Create a new file called compare-rpc.js:
const { ethers } = require('ethers');

// Configuration
const PROVIDERS = {
  provider1: 'YOUR_FIRST_RPC_URL',
  provider2: 'YOUR_SECOND_RPC_URL'
};

const CHAIN_BLOCK_TIME = 250; // milliseconds (adjust for your chain)
const TEST_DURATION = 60; // minutes
const REQUEST_INTERVAL = 60; // seconds between requests

// Store results
const results = {
  provider1: { blockHeights: [], latencies: [], timestamps: [] },
  provider2: { blockHeights: [], latencies: [], timestamps: [] }
};

// Measure request with detailed timing
async function measureRequest(providerUrl) {
  const startTime = Date.now();

  try {
    const provider = new ethers.JsonRpcProvider(providerUrl);
    const blockNumber = await provider.getBlockNumber();
    const endTime = Date.now();

    return {
      blockNumber,
      latency: endTime - startTime,
      timestamp: startTime
    };
  } catch (error) {
    console.error('Request failed:', error.message);
    return null;
  }
}

// Run comparison test
async function runTest() {
  console.log('Starting RPC provider comparison...\n');

  const testStart = Date.now();
  const testEnd = testStart + (TEST_DURATION * 60 * 1000);

  while (Date.now() < testEnd) {
    // Make concurrent requests to both providers
    const [result1, result2] = await Promise.all([
      measureRequest(PROVIDERS.provider1),
      measureRequest(PROVIDERS.provider2)
    ]);

    // Store results
    if (result1) {
      results.provider1.blockHeights.push(result1.blockNumber);
      results.provider1.latencies.push(result1.latency);
      results.provider1.timestamps.push(result1.timestamp);
    }

    if (result2) {
      results.provider2.blockHeights.push(result2.blockNumber);
      results.provider2.latencies.push(result2.latency);
      results.provider2.timestamps.push(result2.timestamp);
    }

    console.log(`Provider 1: Block ${result1?.blockNumber}, Latency ${result1?.latency}ms`);
    console.log(`Provider 2: Block ${result2?.blockNumber}, Latency ${result2?.latency}ms\n`);

    // Wait before next request
    await new Promise(resolve => setTimeout(resolve, REQUEST_INTERVAL * 1000));
  }

  analyzeResults();
}

// Calculate statistics
function calculateStats(values) {
  const sorted = [...values].sort((a, b) => a - b);
  const median = sorted[Math.floor(sorted.length / 2)];
  const p95 = sorted[Math.floor(sorted.length * 0.95)];
  const avg = values.reduce((a, b) => a + b, 0) / values.length;

  return { median, p95, avg };
}

// Calculate freshness score
function calculateFreshnessScore(latency) {
  return 1 - (latency / CHAIN_BLOCK_TIME);
}

// Analyze and display results
function analyzeResults() {
  console.log('\n=== Analysis Results ===\n');

  Object.keys(results).forEach(providerName => {
    const data = results[providerName];
    const latencyStats = calculateStats(data.latencies);

    console.log(`${providerName.toUpperCase()}:`);
    console.log(`  Total Requests: ${data.latencies.length}`);
    console.log(`  Latency (median): ${latencyStats.median.toFixed(2)}ms`);
    console.log(`  Latency (p95): ${latencyStats.p95.toFixed(2)}ms`);
    console.log(`  Latency (avg): ${latencyStats.avg.toFixed(2)}ms`);

    const medianFreshness = calculateFreshnessScore(latencyStats.median);
    const p95Freshness = calculateFreshnessScore(latencyStats.p95);

    console.log(`  Freshness Score (median): ${medianFreshness.toFixed(3)}`);
    console.log(`  Freshness Score (p95): ${p95Freshness.toFixed(3)}`);
    console.log();
  });
}

// Run the test
runTest().catch(console.error);
Update the configuration variables in the script:
- Replace
YOUR_FIRST_RPC_URLandYOUR_SECOND_RPC_URLwith actual RPC endpoints - Adjust
CHAIN_BLOCK_TIMEfor your blockchain (250ms for Arbitrum, ~12000ms for Ethereum, ~400ms for Solana) - Modify
TEST_DURATIONandREQUEST_INTERVALas needed
Then run:
node compare-rpc.js
Analyzing the Results
The script will output real-time comparisons and provide a summary analysis at the end.
Provider 1: Block 386487336, Latency 164ms
Provider 2: Block 386487339, Latency 261ms

Provider 1: Block 386487358, Latency 204ms
Provider 2: Block 386487360, Latency 301ms

Provider 1: Block 386487378, Latency 263ms
Provider 2: Block 386487381, Latency 262ms

Provider 1: Block 386487400, Latency 200ms
Provider 2: Block 386487402, Latency 312ms

Provider 1: Block 386487420, Latency 254ms
Provider 2: Block 386487424, Latency 323ms

Provider 1: Block 386487443, Latency 169ms
Provider 2: Block 386487445, Latency 298ms

Provider 1: Block 386487463, Latency 241ms
Provider 2: Block 386487466, Latency 269ms


=== Analysis Results ===

PROVIDER1:
  Total Requests: 27
  Latency (median): 227.00ms
  Latency (p95): 368.00ms
  Latency (avg): 243.19ms
  Freshness Score (median): 0.092
  Freshness Score (p95): -0.472

PROVIDER2:
  Total Requests: 27
  Latency (median): 316.00ms
  Latency (p95): 589.00ms
  Latency (avg): 356.07ms
  Freshness Score (median): -0.264
  Freshness Score (p95): -1.356
From the data above, Provider 2 consistently returns higher block numbers (2-4 blocks ahead), which initially looks better, it appears to have "fresher" data.
But Provider 1 is significantly faster (~113ms faster at median, ~221ms faster at p95), which is the key insight. Provider 2 returns higher block numbers because its slower response time means it's capturing blockchain state later in the request lifecycle. Meanwhile, Provider 1 captures the state earlier (faster TLS/connection) but delivers it to you more quickly. Even though the block number is lower, the data more accurately represents the chain state at the moment you made the request.
Optimizing Your RPC Usage
Based on your data freshness requirements, here are some strategies:
For applications requiring the most current data:
- Prioritize providers with freshness scores > 0.5
- Monitor median response times
- Consider using WebSocket subscriptions for real-time updates
- Choose providers geographically closer to your application
Note: The latency freshness framework discussed in this guide applies to HTTP-based RPC requests. WebSocket subscriptions operate differently by pushing data to clients as new blocks are produced, eliminating the request/response cycle and its associated latency concerns.
For high-throughput applications:
- Use providers with consistent low latency
- Implement connection pooling
- Cache responses when appropriate
- Consider load balancing across multiple providers
General best practices:
- Regularly benchmark your providers
- Monitor for degradation over time
- Have backup providers ready
- Use health checks and automatic failovers
Frequently Asked Questions
What is data freshness in blockchain RPC performance?
Data freshness measures how quickly an RPC provider delivers blockchain state relative to when blocks are produced. It considers both response time and how current the data was when captured, not just the block number returned.
Why can a higher block number be misleading when comparing RPC providers?
A provider returning higher block numbers may simply have slower response times, meaning it captures blockchain state later in the request lifecycle. Faster providers with lower block numbers often deliver data that more accurately represents the chain state when you requested it.
How is the latency freshness score calculated?
The freshness score formula is: 1 - (latency / avgBlockTime). Scores above 0 mean you're retrieving blocks faster than they're produced, scores at 0 mean you're just keeping pace, and negative scores indicate you're falling behind blockchain production.
What are the key metrics for comparing RPC provider performance?
The two primary metrics are block height (which block number is returned) and response time (latency). However, these should be evaluated together through a data freshness lens rather than separately.
Wrapping Up
Understanding data freshness helps you make better decisions when choosing RPC providers. A provider returning higher block numbers isn't necessarily better, what matters is how quickly and reliably you can access blockchain data relative to when blocks are produced. By measuring latency freshness scores alongside traditional metrics, you gain a complete picture of provider performance and can select the best option for your application's specific needs.
Join our Discord if you have any questions, or reach out to us via Twitter.
We ❤️ Feedback!
Let us know if you have any feedback or requests for new topics. We'd love to hear from you.