
10 min read
Overview
Are you finding it challenging to keep up with your blockchain data usage? Quicknode has got you covered! With its powerful tools and metrics, managing your blockchain activity has never been easier. This guide will walk you through the powerful insights and features that the Quicknode User Dashboard offers and how best to utilize them. Let's dive in!
What is the Quicknode User Dashboard?
The Quicknode User Dashboard is your central hub for building and managing blockchain infrastructure. From creating endpoints for specific blockchains to enabling advanced security features like JSON Web Tokens (JWT), it gives you everything you need to launch and scale with ease.
Inside the dashboard, you can explore powerful tools like Streams for backfilling and accessing real-time data, and enhance your performance with Marketplace add-ons like Single Flight RPC and the Solana Priority Fee API—all designed to make your setup faster, smarter, and more efficient.
In this guide, we'll be covering the following features and products:
- Endpoint Metrics
- Usage & Billing
- Security
- Marketplace
- Streams
- Webhooks
- IPFS
- Members, Teams, and Roles
- API Keys
Home Dashboard
To access the User Dashboard, you'll need a Quicknode account. You can create one for free here.
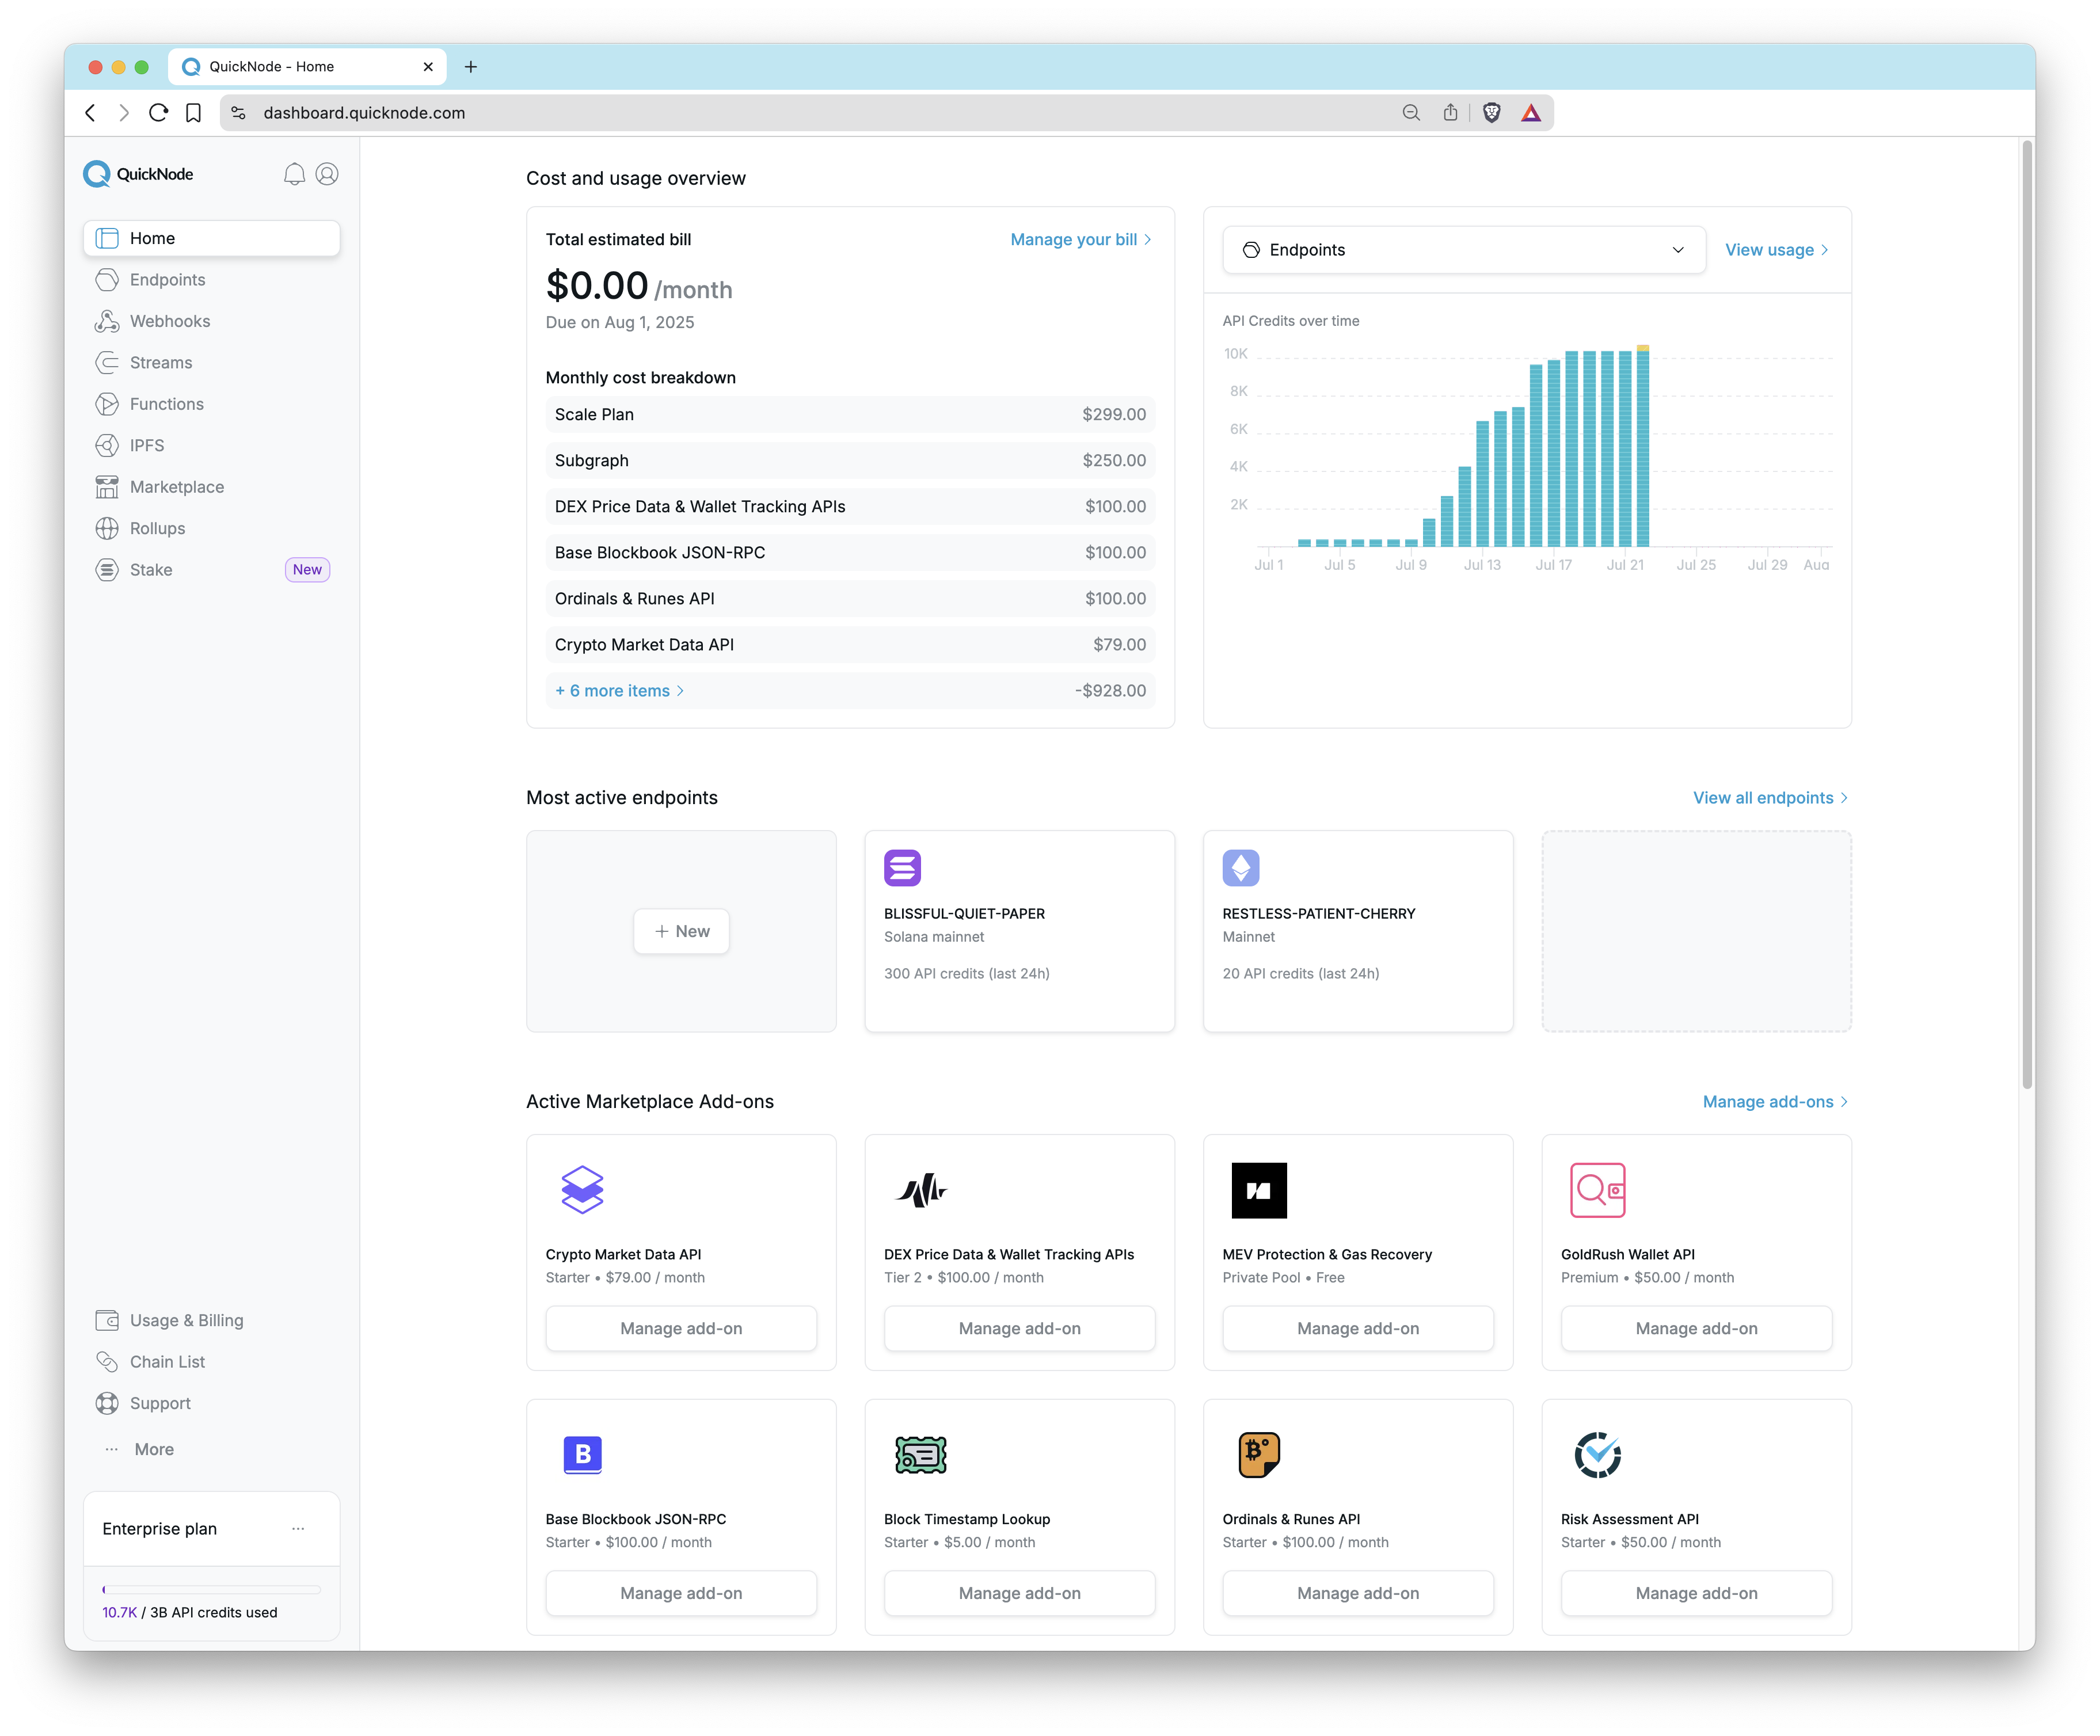
When you first log in to your Quicknode account, you'll be greeted with the Home dashboard. This page provides a complete, at-a-glance overview of your account activity.
From here, you can immediately see:
- Cost and usage overview: A summary of your estimated monthly bill and a detailed cost breakdown.
- Usage over time: A graph visualizing your recent endpoint usage or your product usage (e.g., Streams, IPFS).
- Most active endpoints: A quick-view list of your top endpoints and their recent credit usage.
- Active Marketplace Add-ons: A list of the add-ons you are currently subscribed to.
- IPFS Storage Usage: A summary of your IPFS storage usage, including the total size used and total bandwidth consumed.
Endpoints
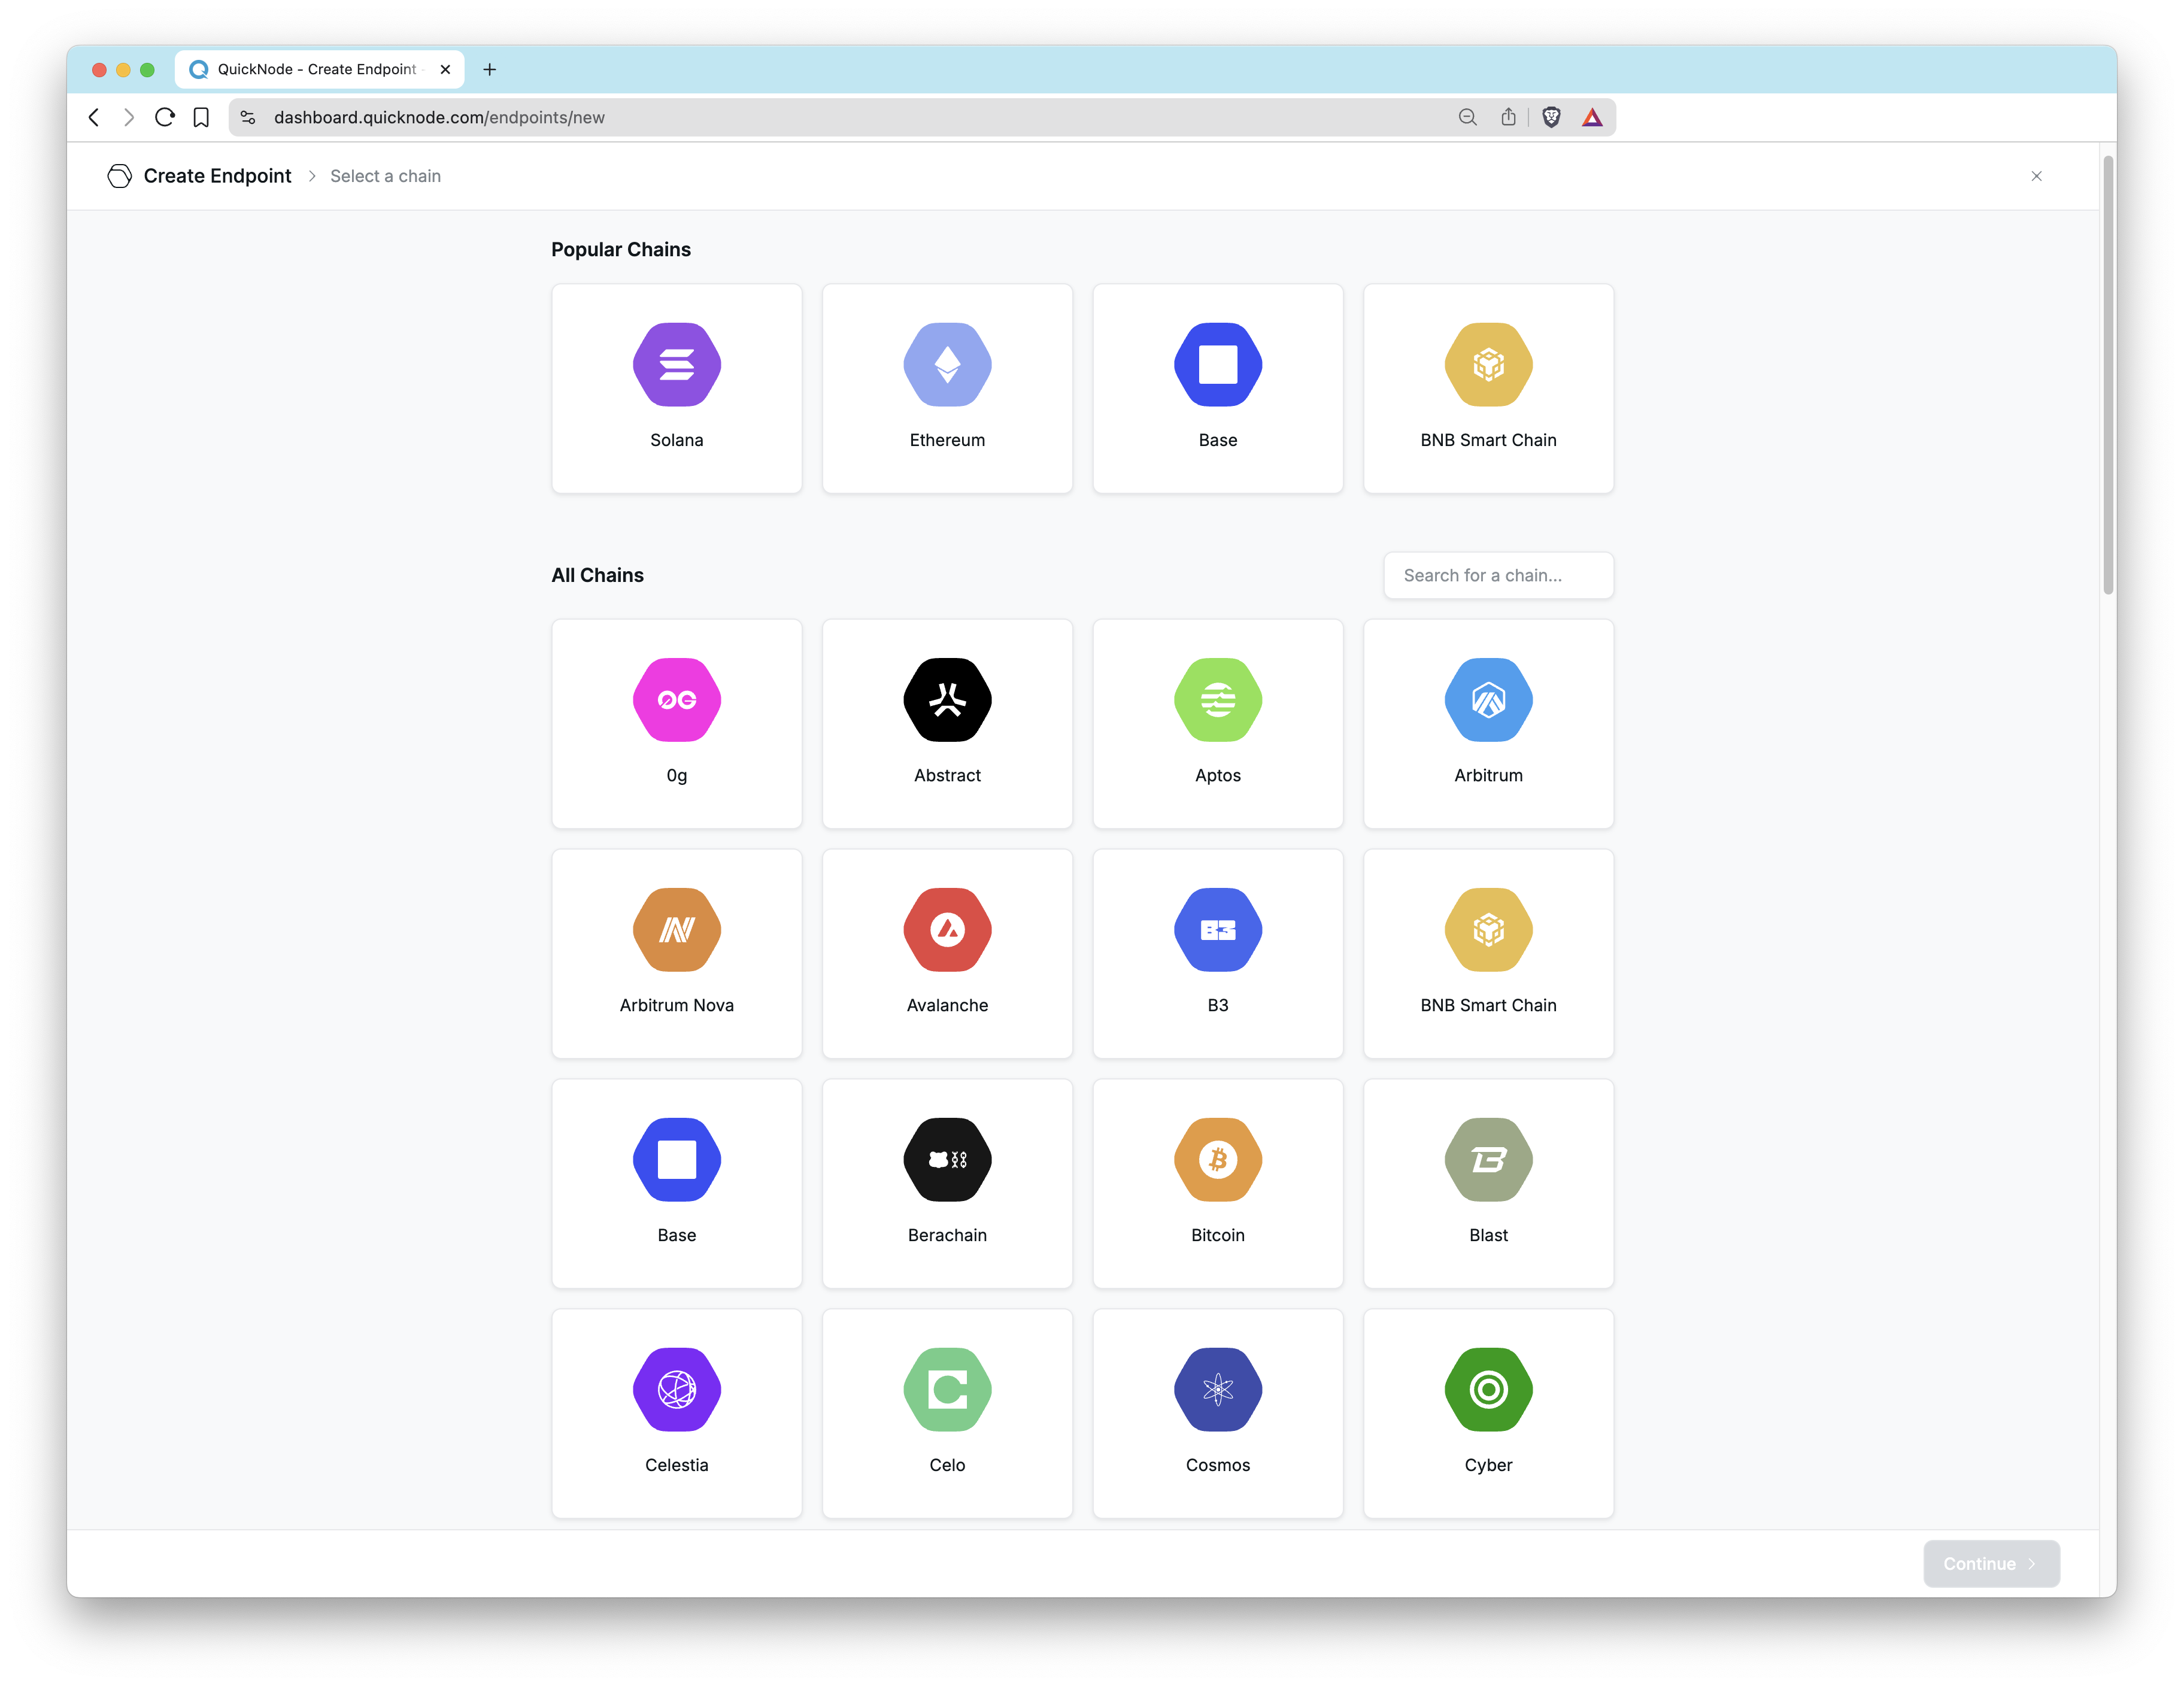
To create a new endpoint, navigate to the Endpoints page and click the Create an Endpoint button. Then, choose the blockchain and network you want access to.
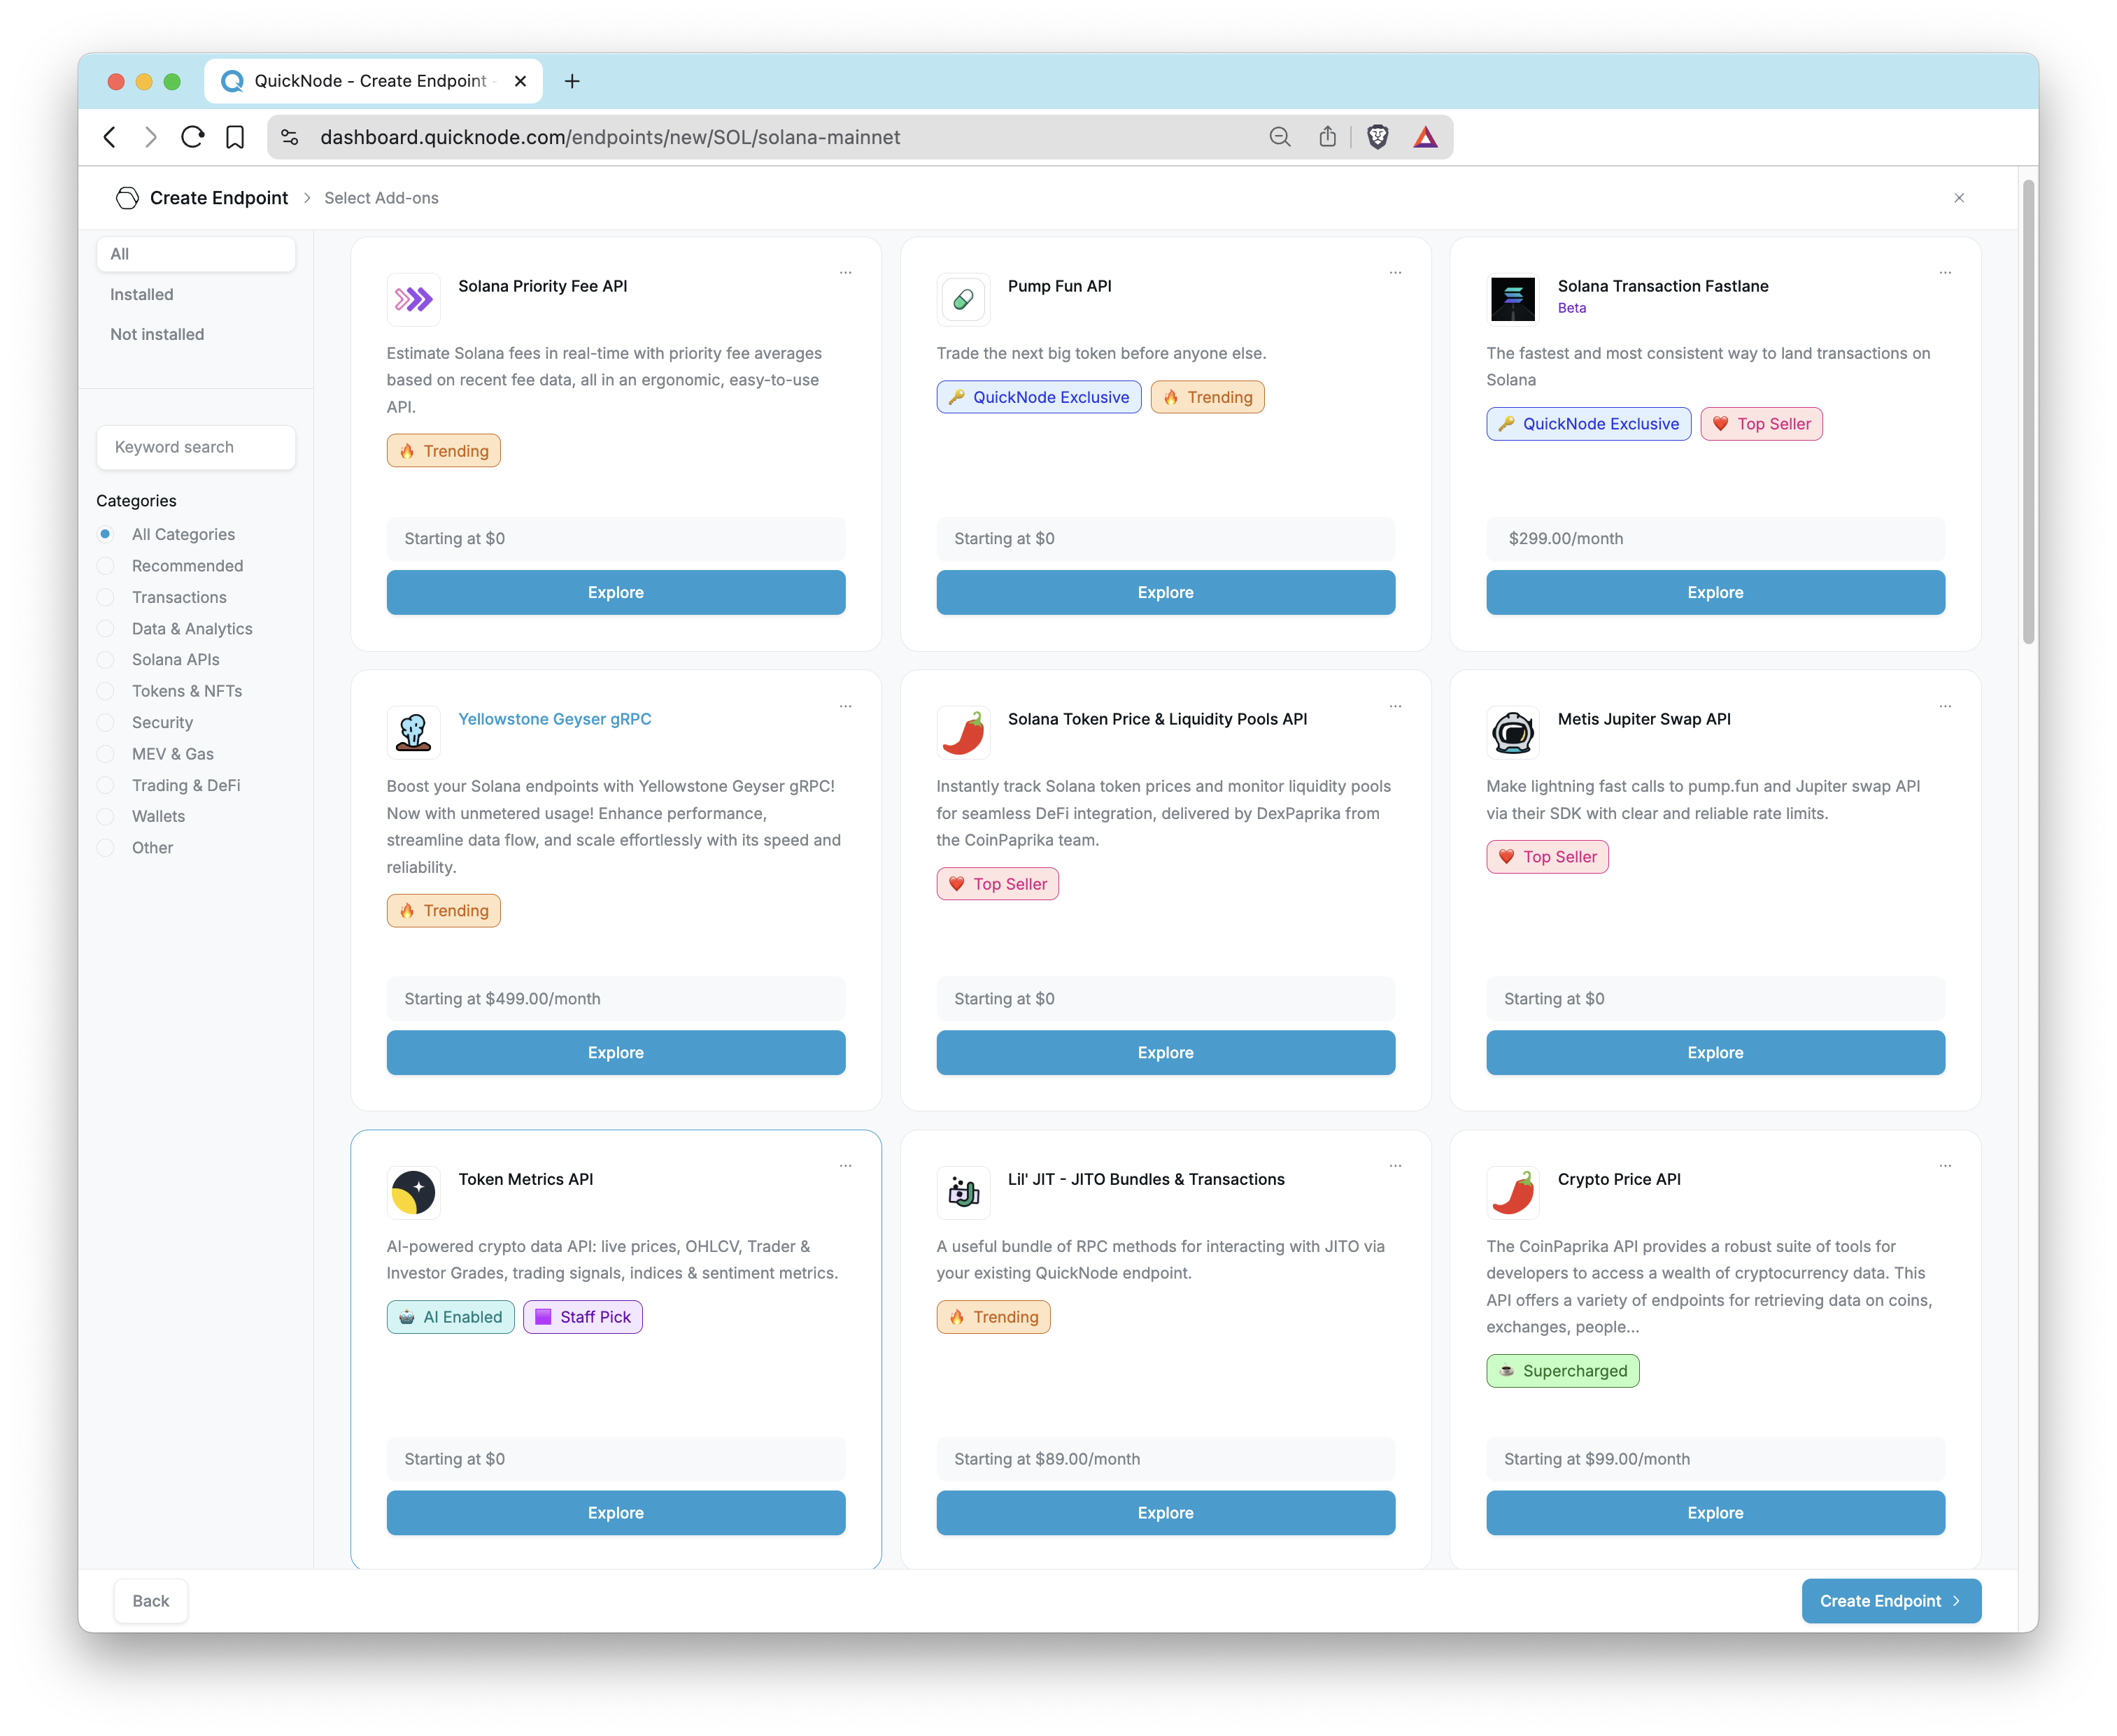
Then, according to the blockchain and network you have selected, you can see the available add-ons recommended for your endpoint. You can review and add these add-ons or continue without them.
Once you create an endpoint, the Quicknode dashboard provides a comprehensive overview on the Endpoints page. At the top, you can set a custom label for your endpoint by clicking the pencil icon and organize it further by adding tags. The dashboard displays your total requests and API credit usage. Besided this, you'll find the endpoint URLs for both WSS and HTTPS, followed by client details and network uptime status. For quick access to helpful materials, the Developer resources page provides sample projects, walk-through sample codes, and recommended guides.
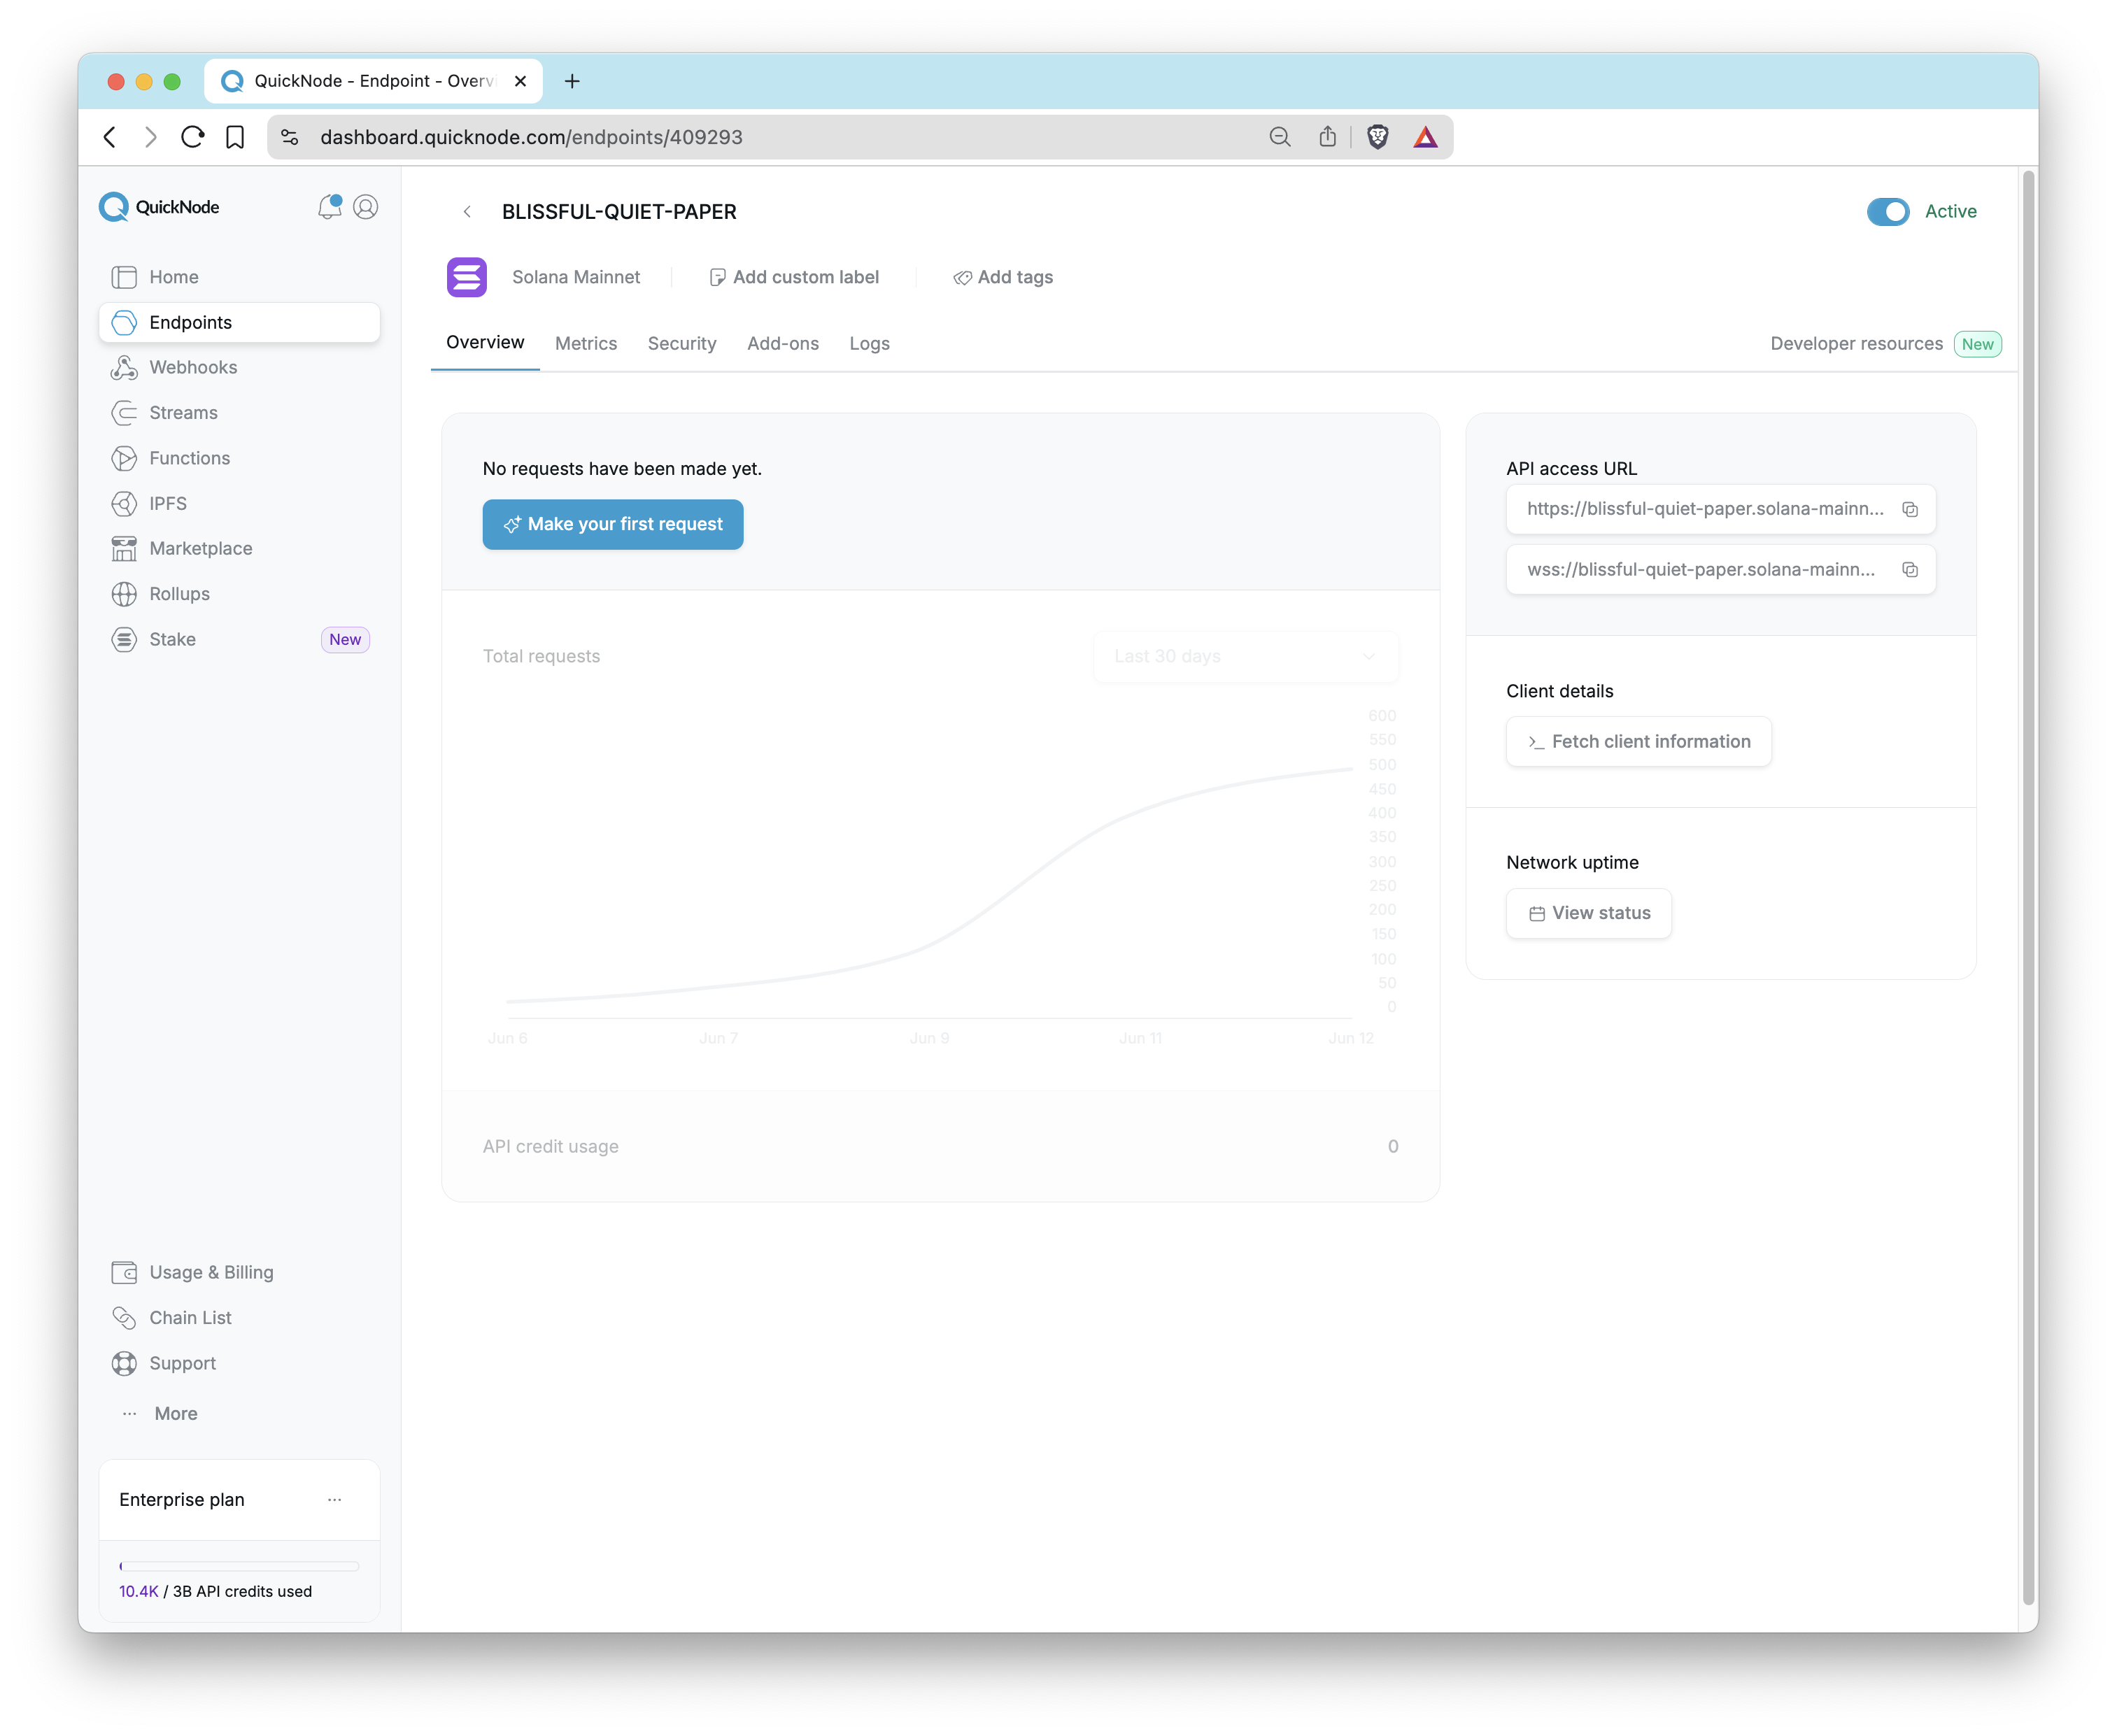
Now, let's continue with the Metrics tab.
Metrics
On the Metrics tab, you can see all activity related to a specific endpoint. At a glance, you can see the total number of Requests and Errors in a rolling 30-day period.
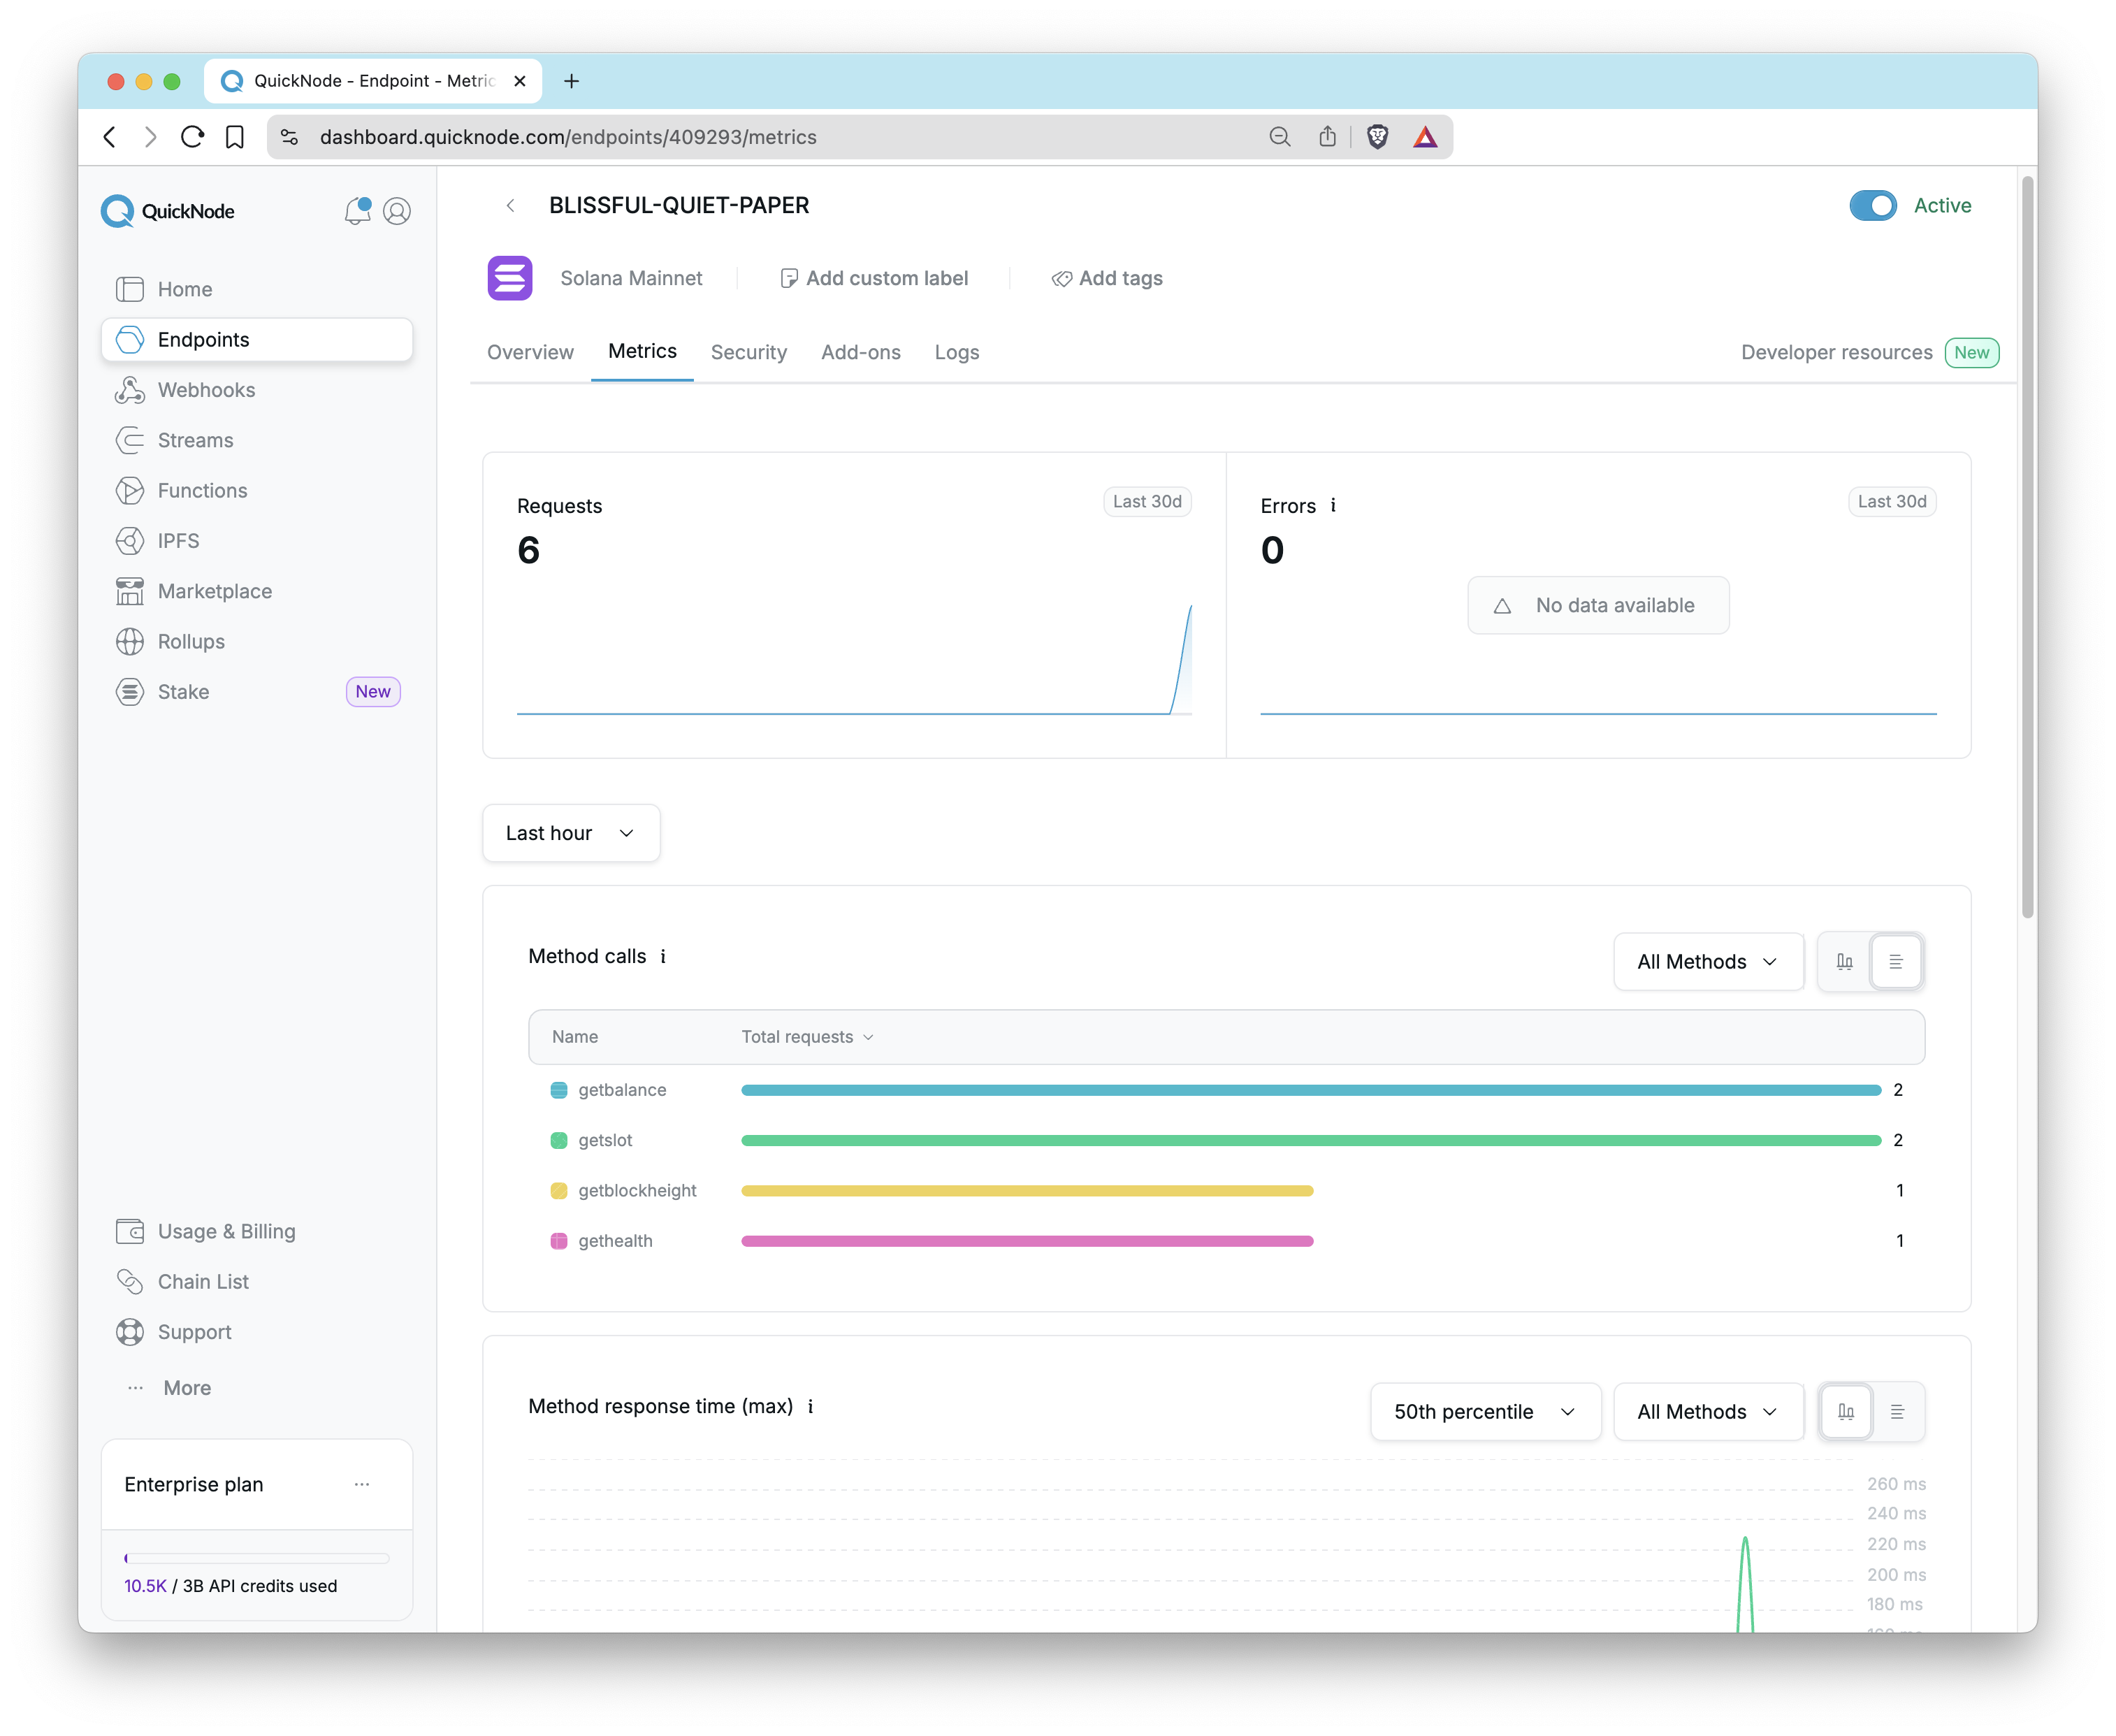
Visually tracking your activity is crucial, and the Metrics tab offers several interactive graphs and tables to break down your RPC calls. For each type of metric, you can toggle the view between an Over time graph and a Breakdown table. You can also adjust the time frame (from the last 15 minutes to the last 3 months) and filter the data to include all methods or only specific ones. The primary visualizations include:
-
Method Calls: This graph shows your endpoint's activity. Additionally, you can filter the view to show all methods or only specific ones.
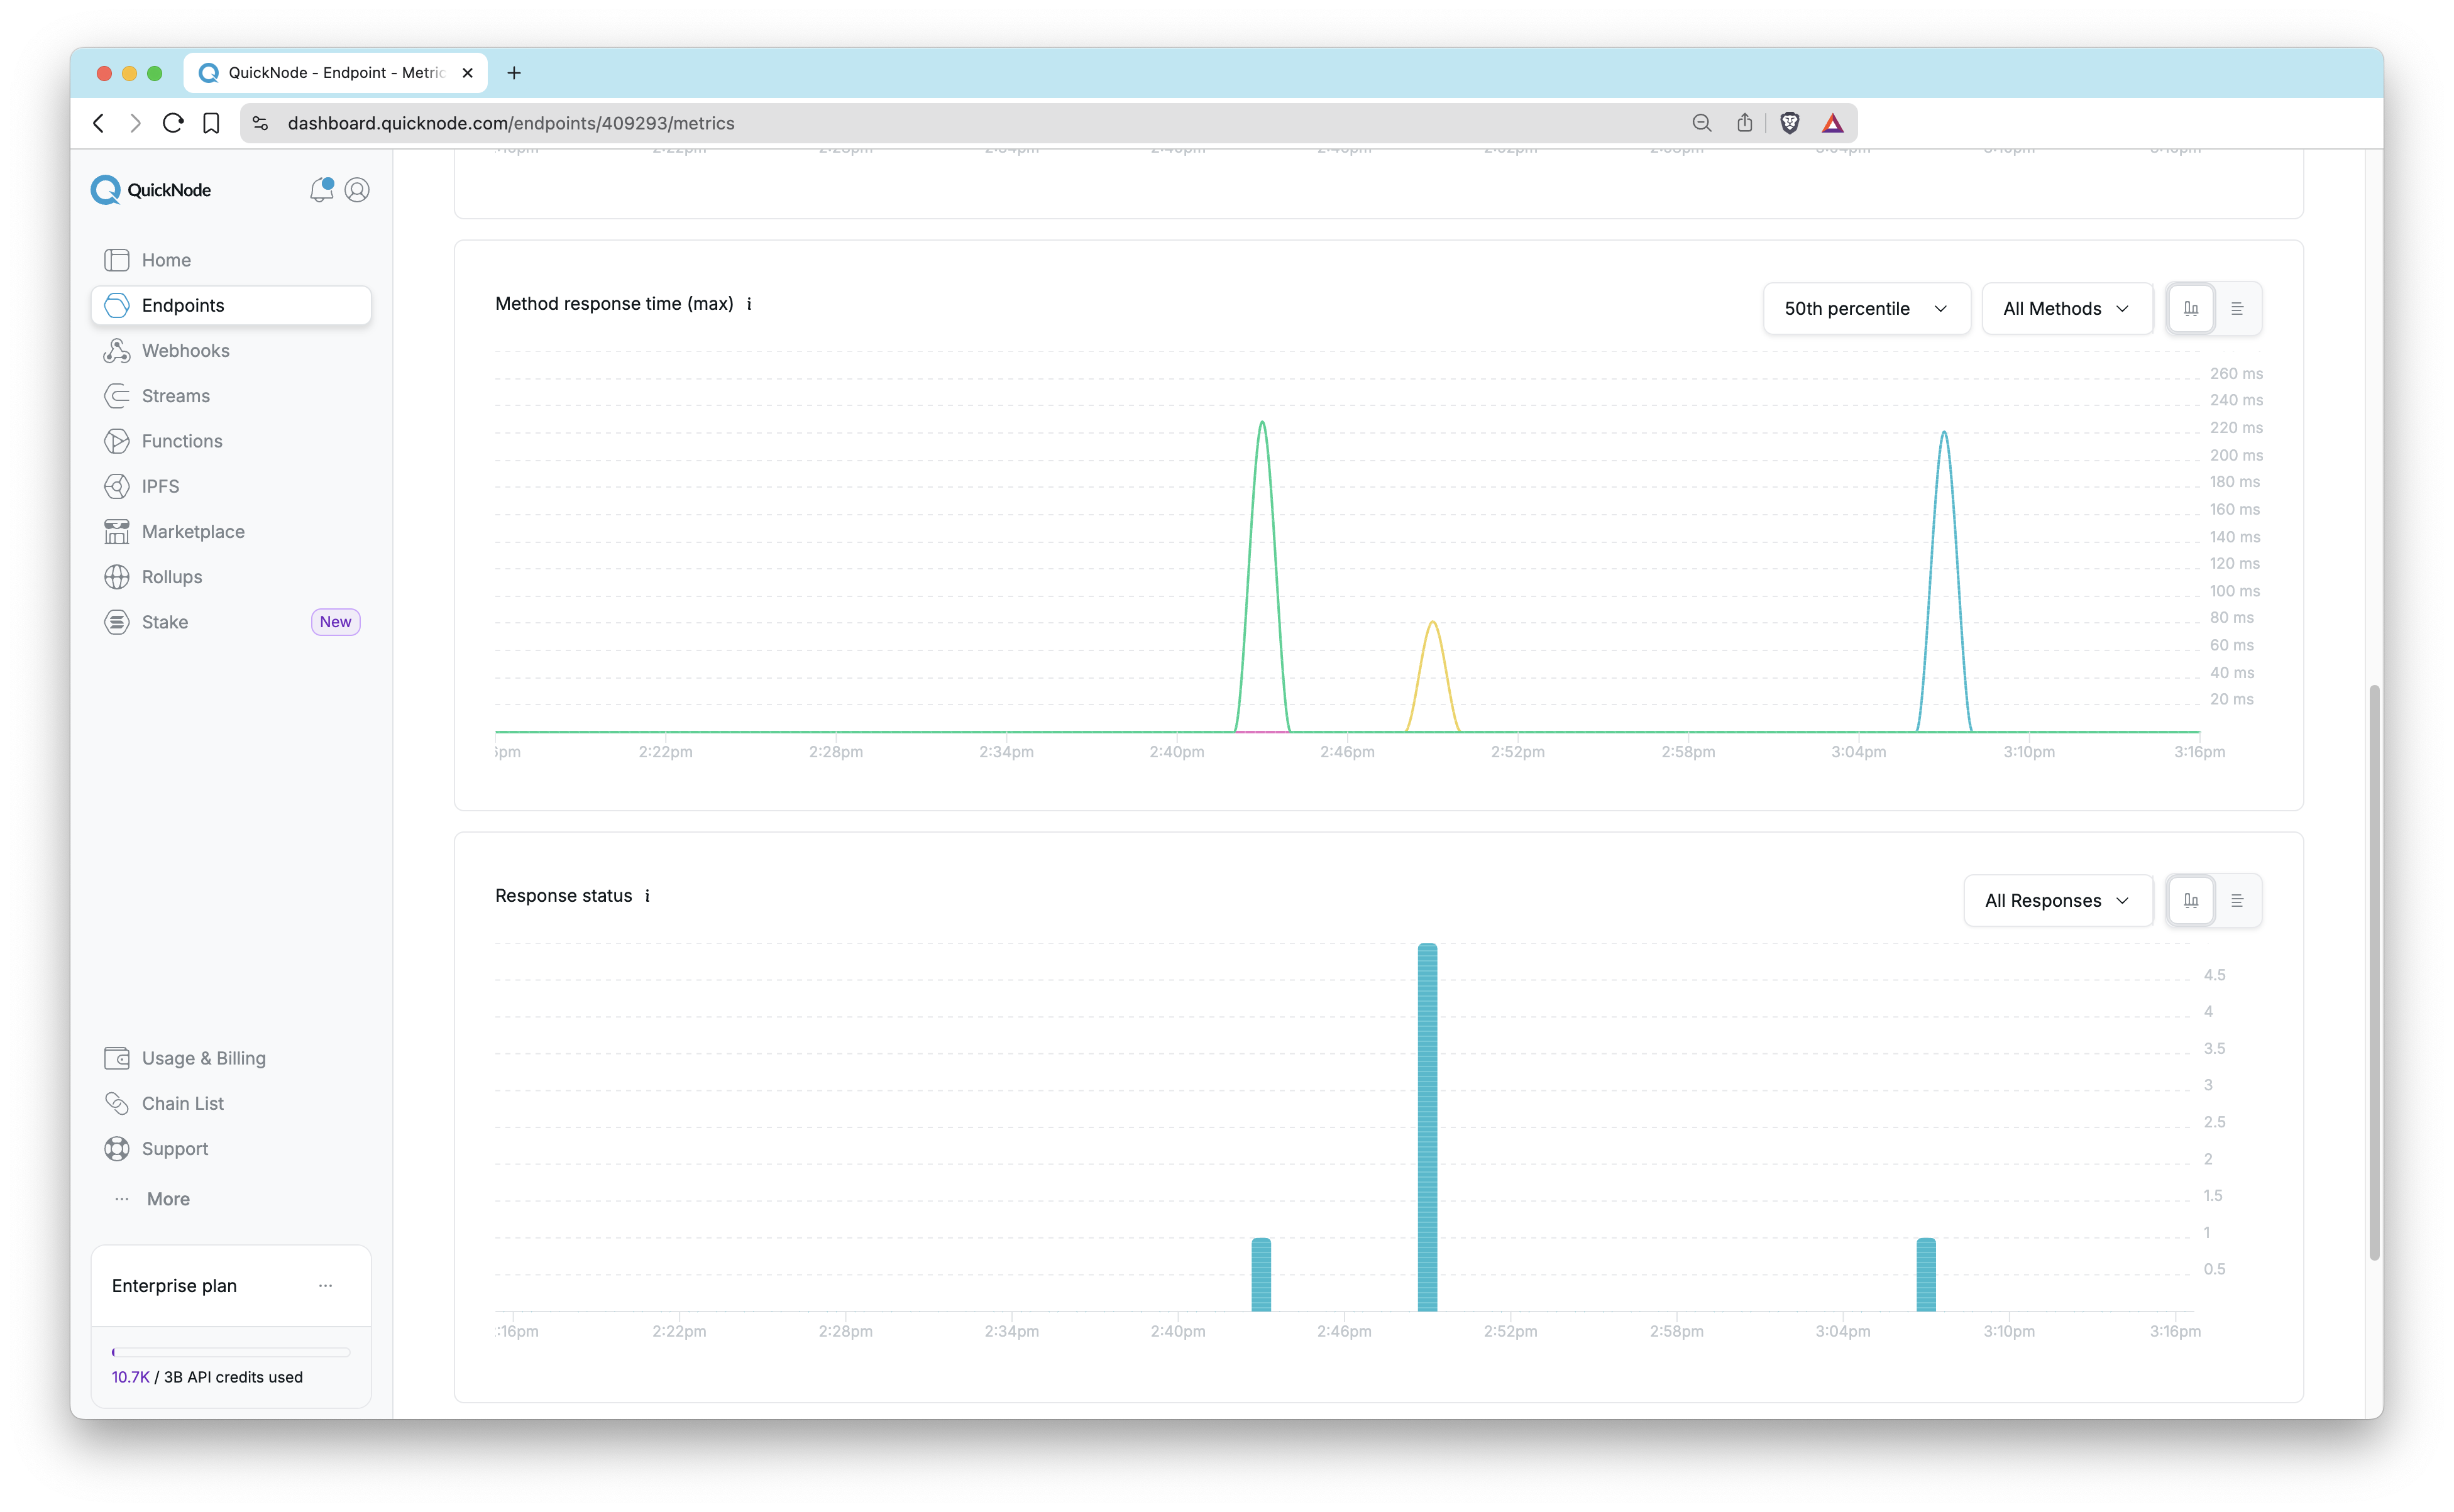
-
Method Response Time: This graph shows maximum method response time with different percentiles (50th, 95th, and 99th) to analyze performance. The maximum metric represents the highest response time observed during the time interval. For instance, if we receive 1 million responses and the highest time taken was 200ms, then 200ms would be recorded as the maximum value for that interval. This is also filterable by method.
-
Response Status: Track the status codes of the responses your endpoint is serving. This can be filtered down by HTTP response codes.
-
Errors: If your endpoint is experiencing issues, this section allows you to investigate and analyze any errors that occur.
The metrics dashboards described above are only available to users on the Build plan and above. Check out our pricing for more information.
Usage & Billing
Another important component of understanding your endpoint and usage can be reviewed on the Usage & Billing tab. This page provides information regarding usage on your account (in terms of API Credits), while the Metrics tab is focused on endpoint performance.
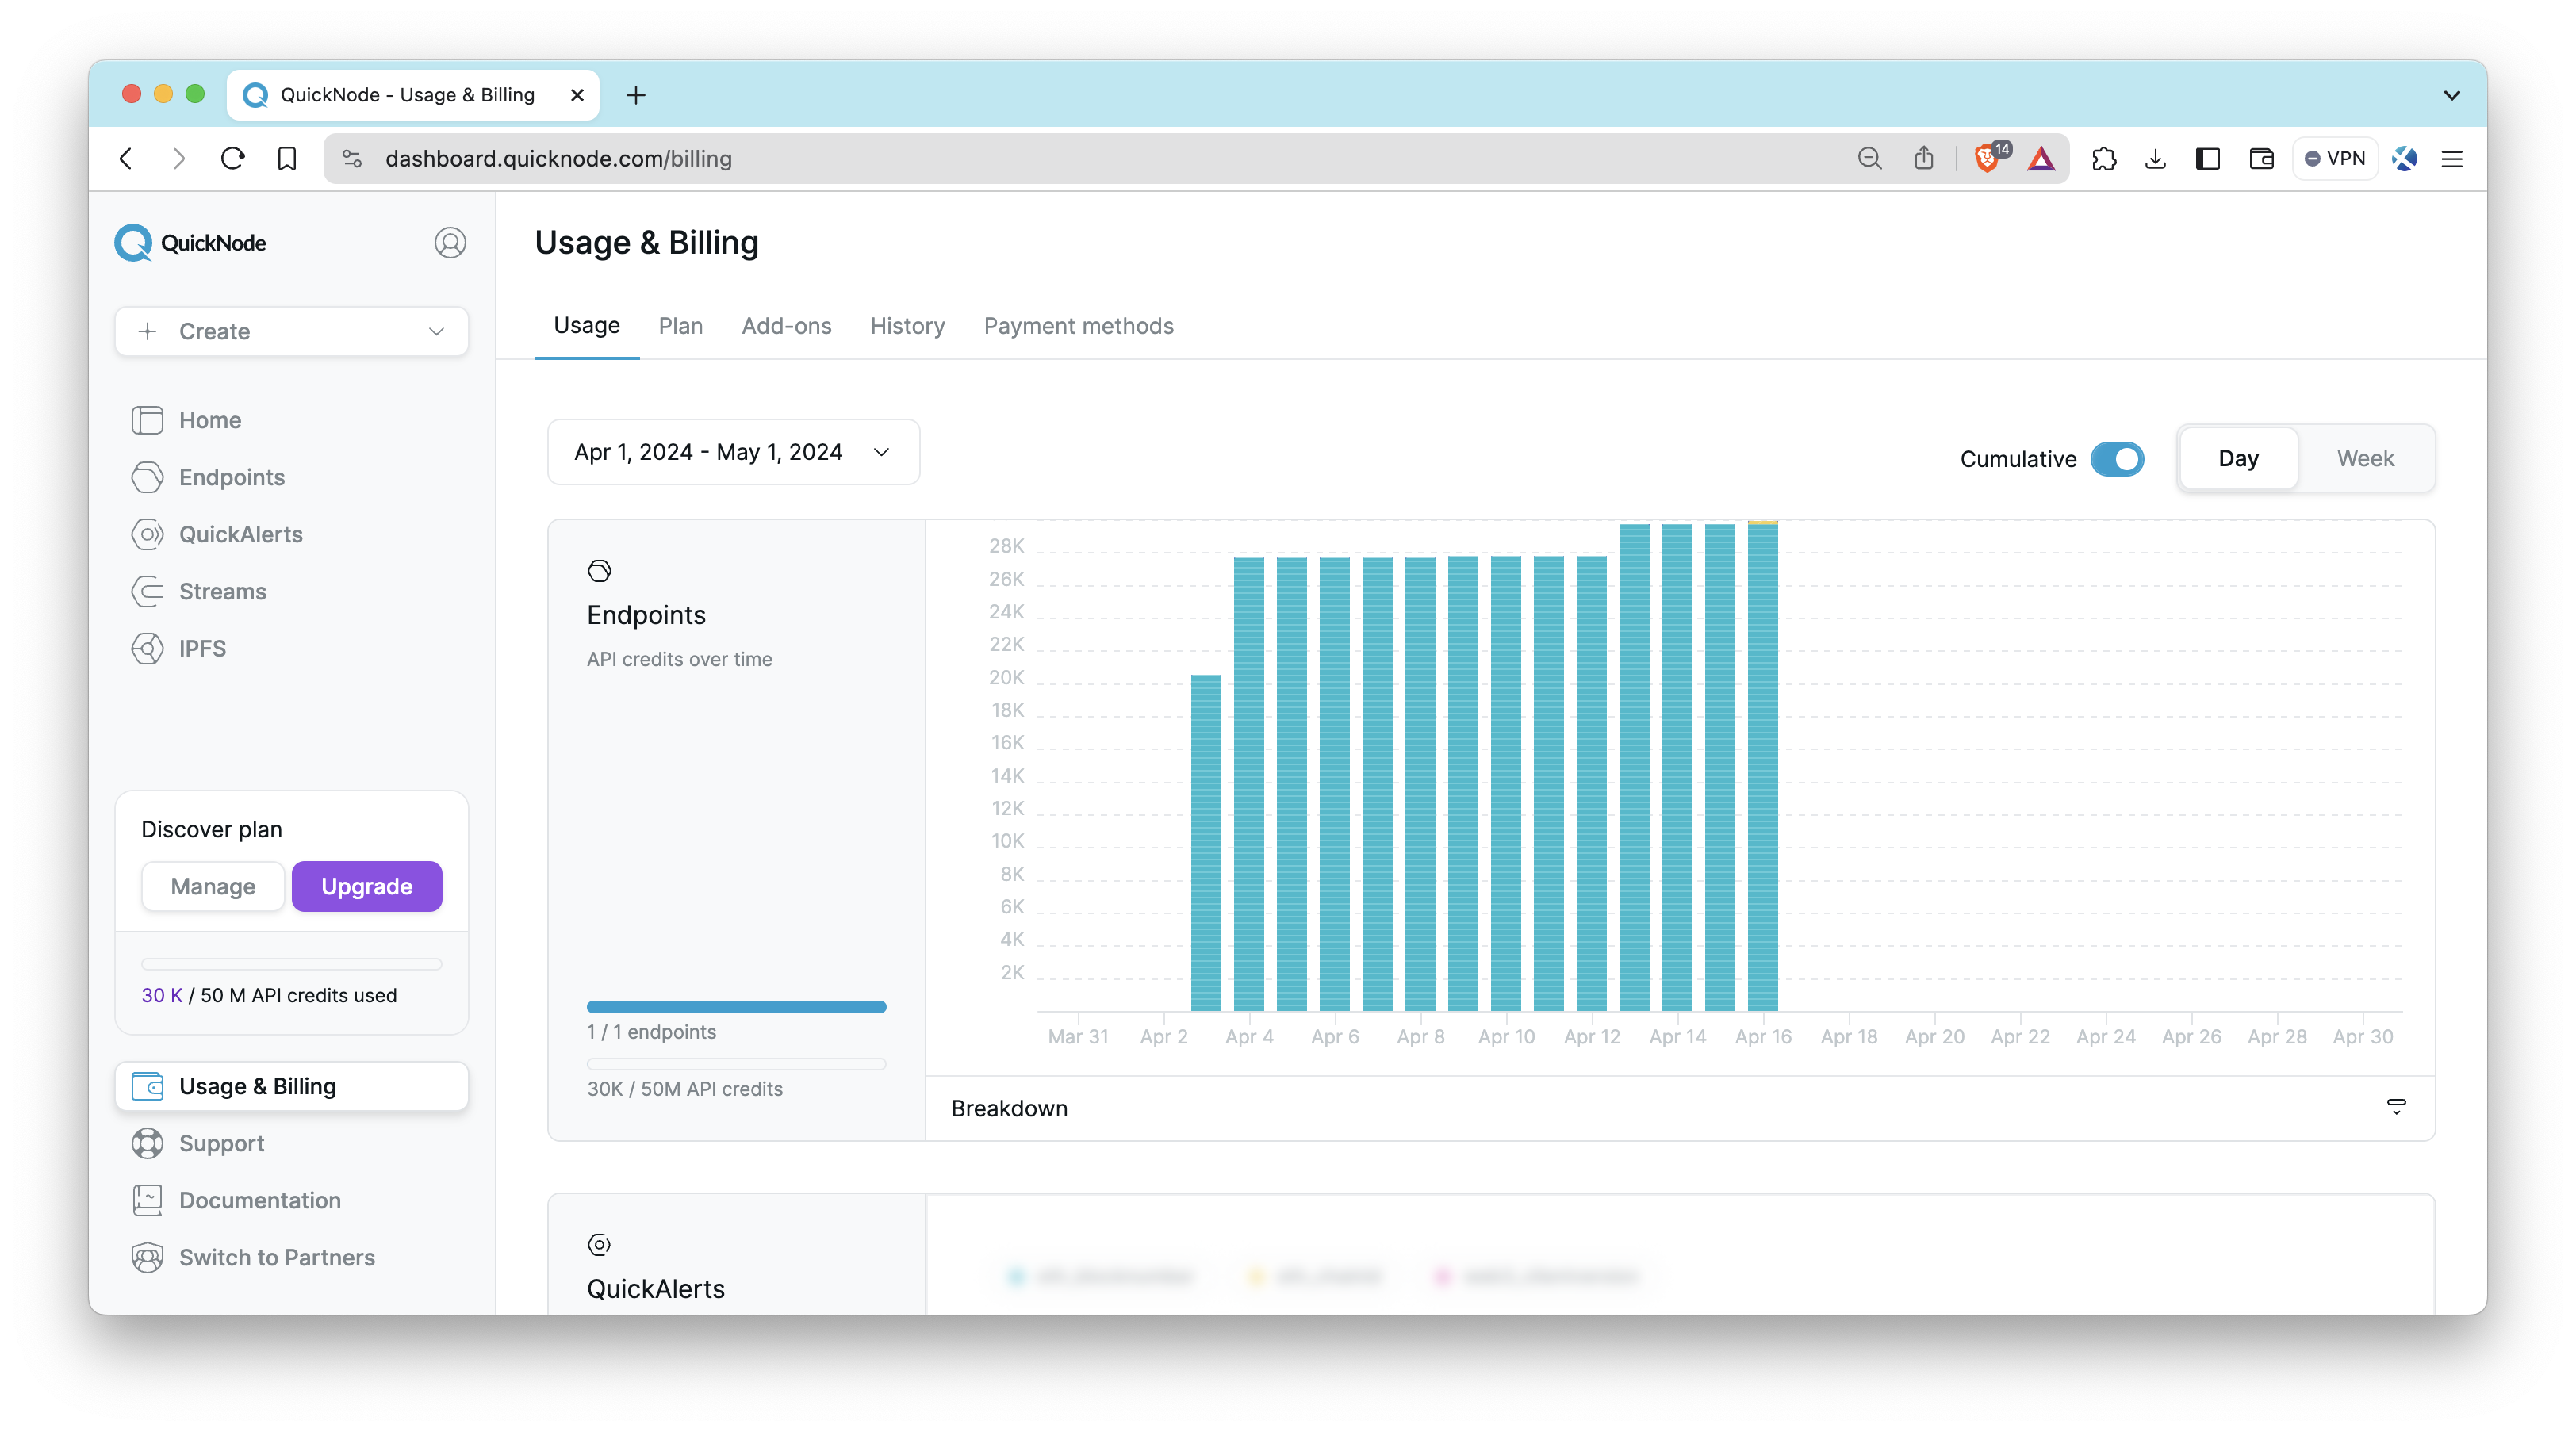
Usage
The Usage tab will show details such as the number of endpoints you have active, how many you can create on your plan, credit usage, and credit usage over time. Note that the data on this tab is derived from your cumulative usage across all endpoints in terms of API credits (which differs from the responses shown on the Metrics tab) and reflects this usage in your current billing cycle. The billing cycle is usually the date of the payment plus one month, and users can choose the period. This differs from the data shown on the Metrics tab, which tracks responses in a rolling 30-day period (the current time minus 30 days).
To better understand how many API Credits your endpoint has used, you can also view the breakdown at an endpoint level:
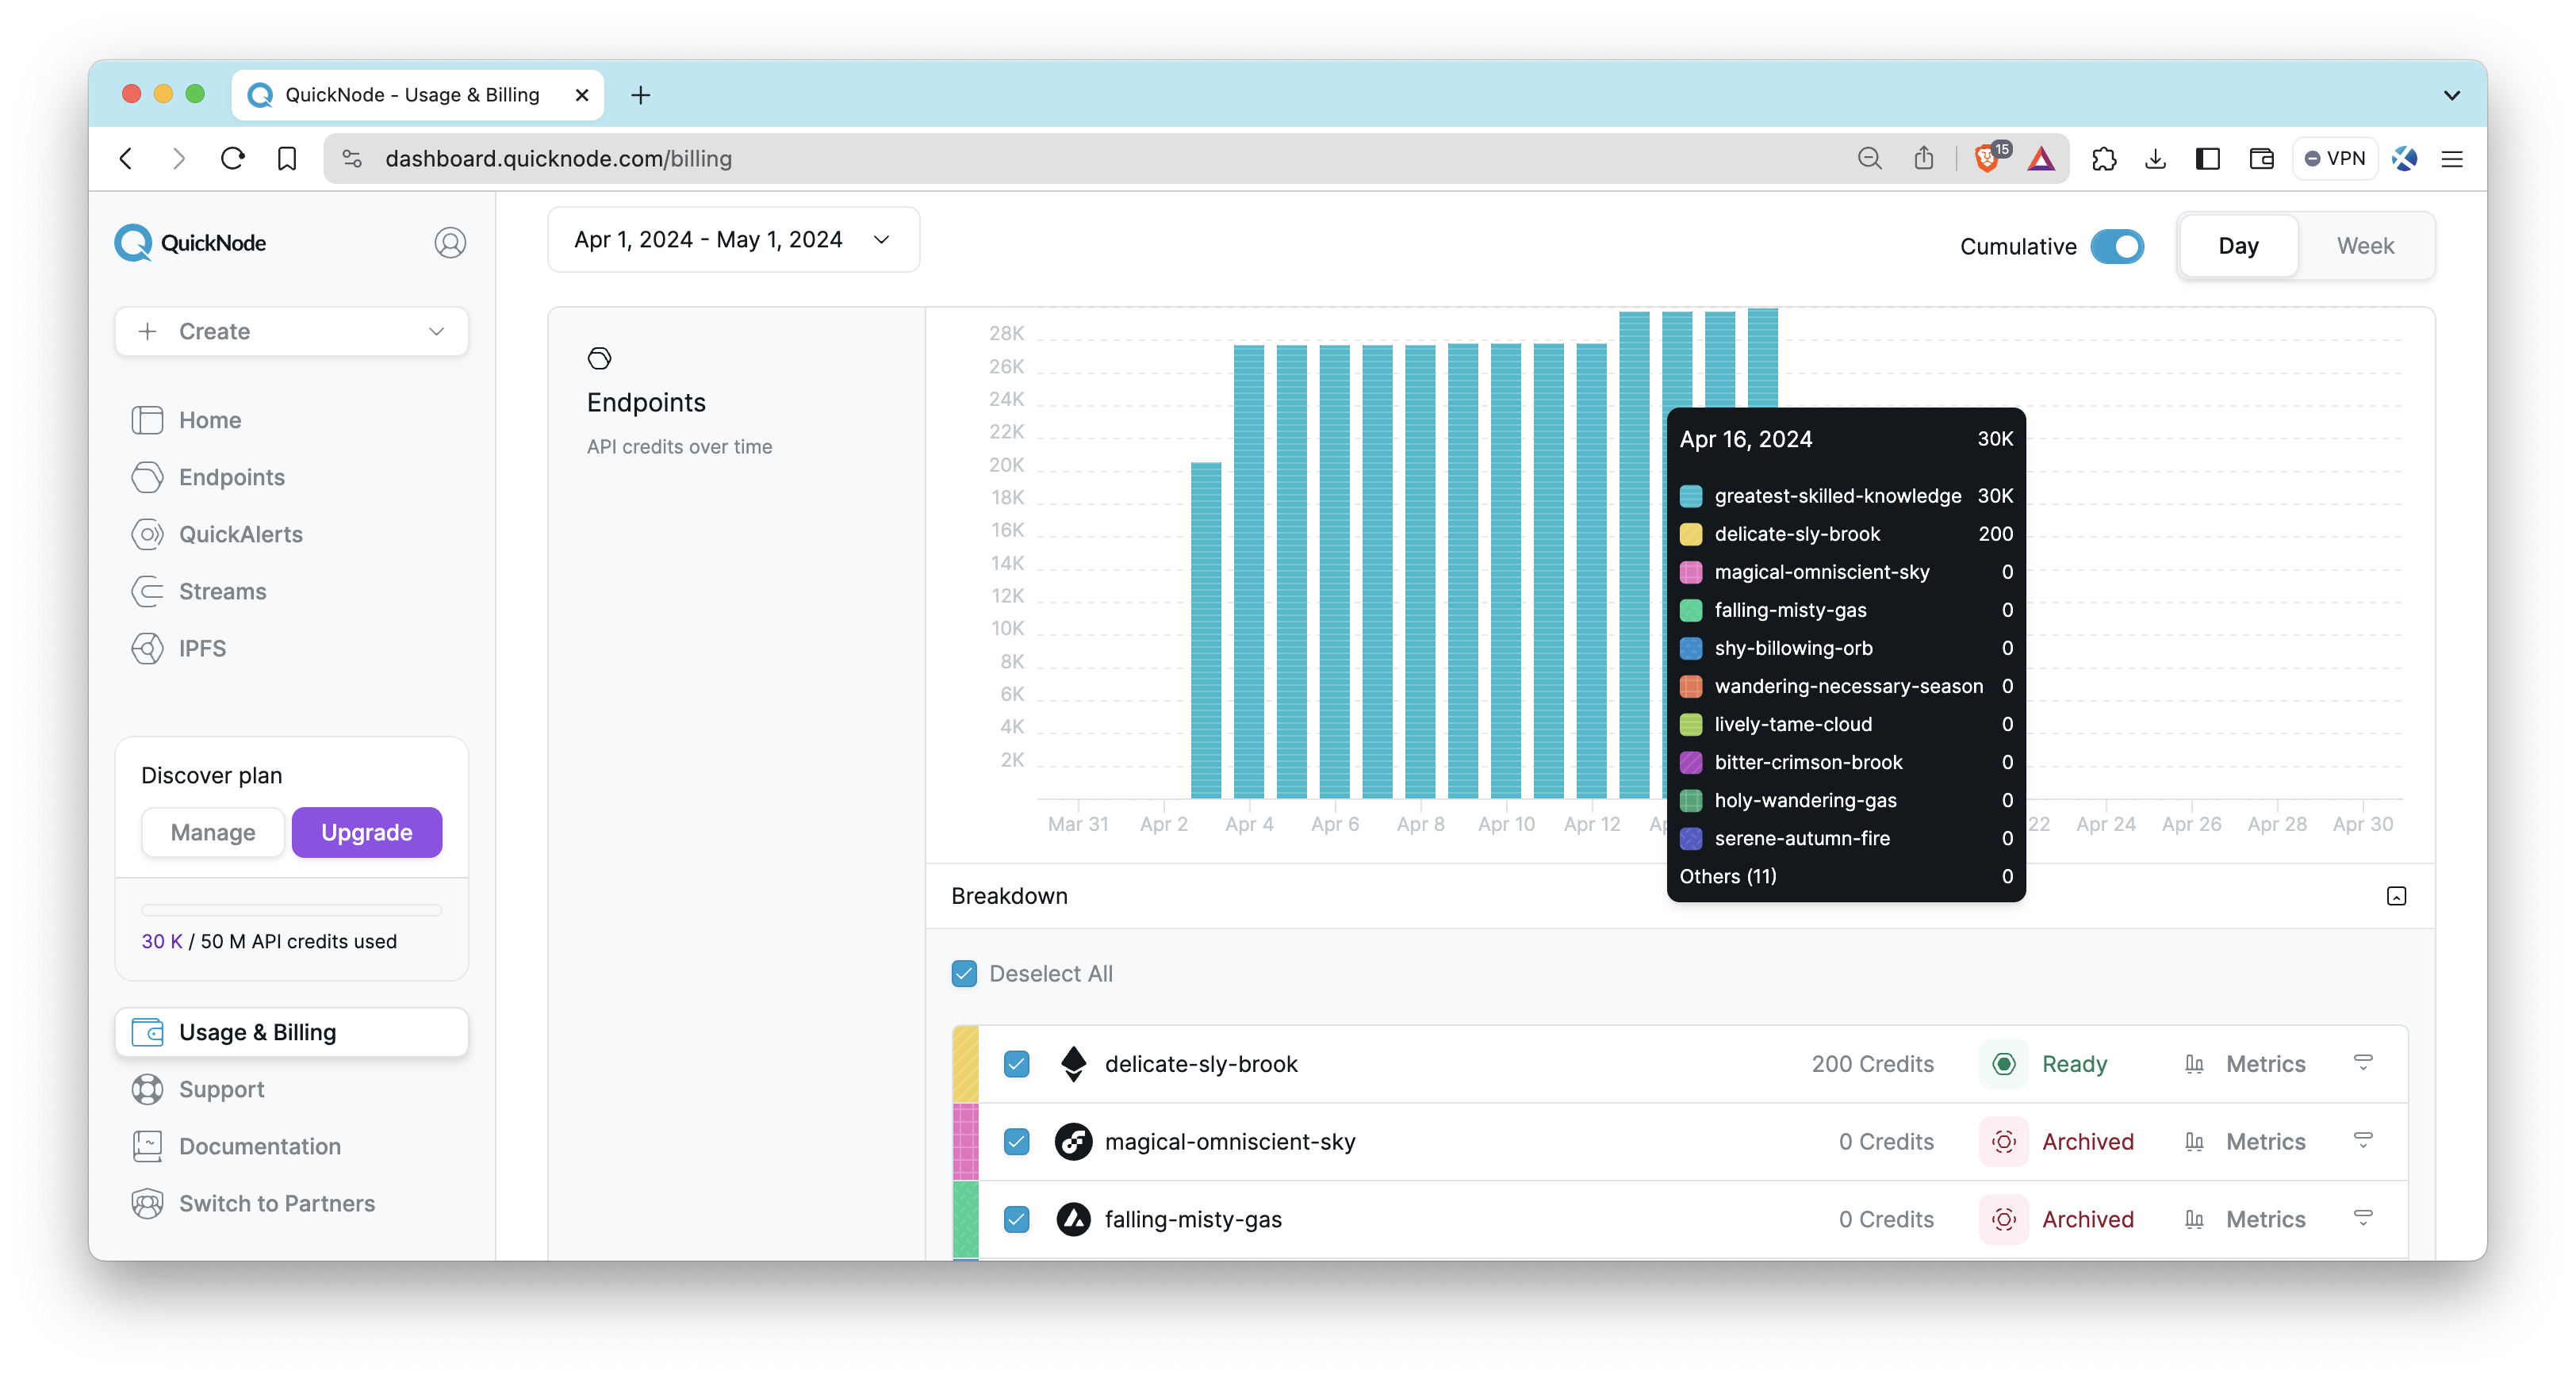
For more information about API Credits and how they are calculated, check out this post. The remaining tabs on this page are described here:
- Plan: Displays information regarding your plan type, invoices, and any subscription settings you may want to update
- Add-ons: Configure your add-ons and see which are already included in your plan
- History: Displays payment history
- Payment methods: Update and manage your payment method on file
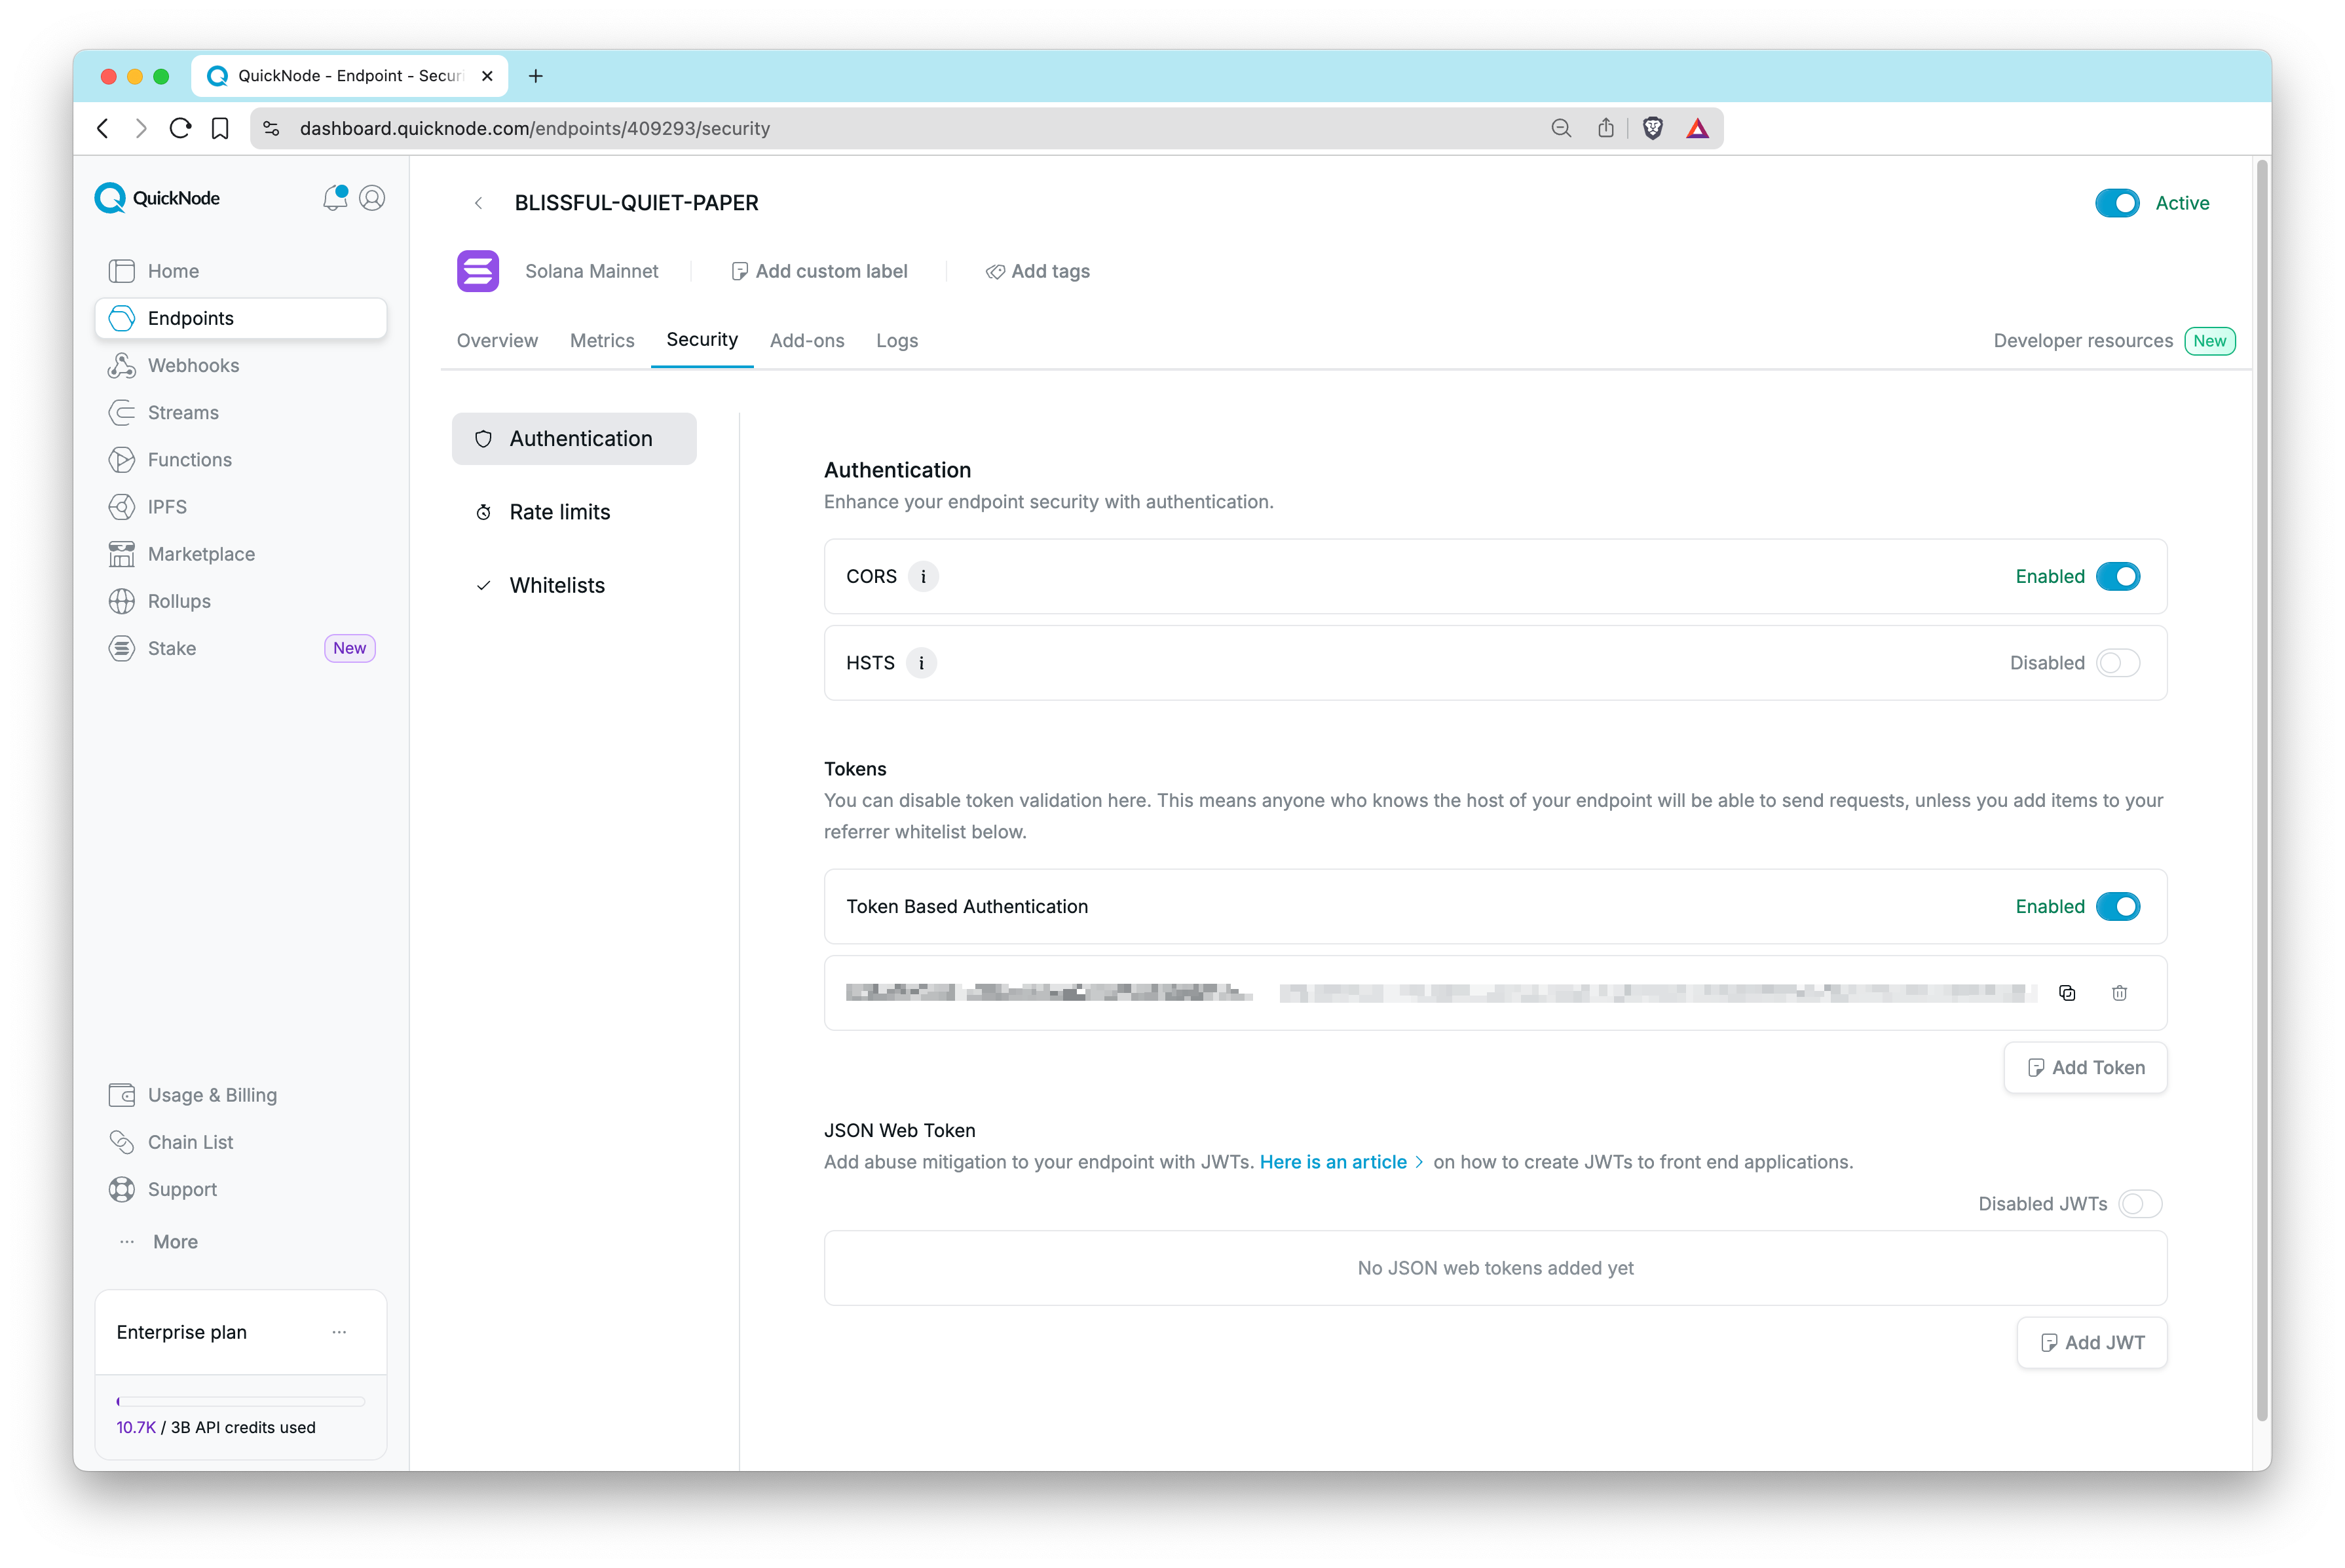
Security
In the Security tab of your endpoint, you'll find that Quicknode offers various security features for your endpoint, which caters to a wide range of use cases.
Advanced security controls are only available to users on the Build plan and above. The list of advanced security controls can be found in the Pricing page.
Authentication
Token Based Authentication
Endpoints, by default, come with token-based authentication enabled, however, you can disable this feature if you wish. Note that disabling token-based authentication allows anyone who knows your hostname to make requests to your endpoint. You can also create multiple authentication tokens, which enables you to add and remove specific authentication tokens. This can be useful for developing teams to better manage endpoint usage or for security measures such as a comprised endpoint (learn more about multi-token auth in this Quicknode guide).
Security Policies
You can configure additional security layers for your endpoint:
- CORS (Cross-Origin Resource Sharing): CORS policies control which external domains are allowed to access your endpoint's resources.
- HSTS (HTTP Strict Transport Security): HSTS enforces that your endpoint should only ever be accessed using a secure HTTPS connection.
JSON Web Tokens
A popular security feature for modern applications is JSON Web Tokens (aka JWT). This allows for authentication on the client side and can improve security between your endpoint and front-end. Learn how to add JWT to your front-end application in this Quicknode guide.
Rate Limits
Rate limits help you control the traffic to your endpoint and prevent abuse. Quicknode offers two layers of control: Basic Limits and Method Limits.
Basic Limits
This sets a general request limit for the endpoint. You can set the rate by Requests per Second, Requests per Minute, or Requests per Day.
Additionally, you can enable the Limit by IP address* toggle. This applies the rate limit to each connecting IP address individually, which is highly recommended for public-facing endpoints to ensure fair usage.
Method Limits
For more granular control, you can also apply specific rate limits to individual RPC methods. This allows you to prevent the overuse of resource-intensive calls without affecting other methods.
Whitelists
Whitelists are a powerful way to control access to your endpoint. Quicknode offers several types of whitelists to secure your endpoint:
Referrer Whitelist
Referrer whitelisting allows you to whitelist specific hostnames to have access to your endpoint. If the API request arrives without a whitelisted domain name in the Referrer or Origin HTTP header, the request will be denied. Learn how to set up a referrer whitelist in this Quicknode guide.
Methods
When enabled, only the RPC methods you explicitly add to the list can be called. This is useful for preventing malicious or unintended calls to your endpoint.
Domain Masks
You may want to mask your endpoint with another name (for example, your branded domain name). Domain masking can help you accomplish this. You'll want to add the domain to the list and then update your domain's CNAME settings to include your endpoint name. Check out this Quicknode guide to learn more about domain masks.
Source IP
IP whitelisting is another feature that is available to your Quicknode endpoint. You can add up to 25 IP addresses you wish to whitelist for your endpoint. This security feature differs from referrer whitelisting as it takes an IP (e.g., 123.123.123.123 vs. quicknode.com).
IP Custom Header
Specify an HTTP header (e.g., CF-Connecting-IP) that your environment uses to pass the client's real IP address. This ensures Source IP whitelisting works correctly when you are behind a proxy or CDN.
Marketplace Add-ons
Quicknode Marketplace allows users to enhance their endpoints' capabilities by installing add-ons. In the Add-ons tab, you'll find that Quicknode offers a variety of useful add-ons and tools you can use to supplement your blockchain infrastructure.
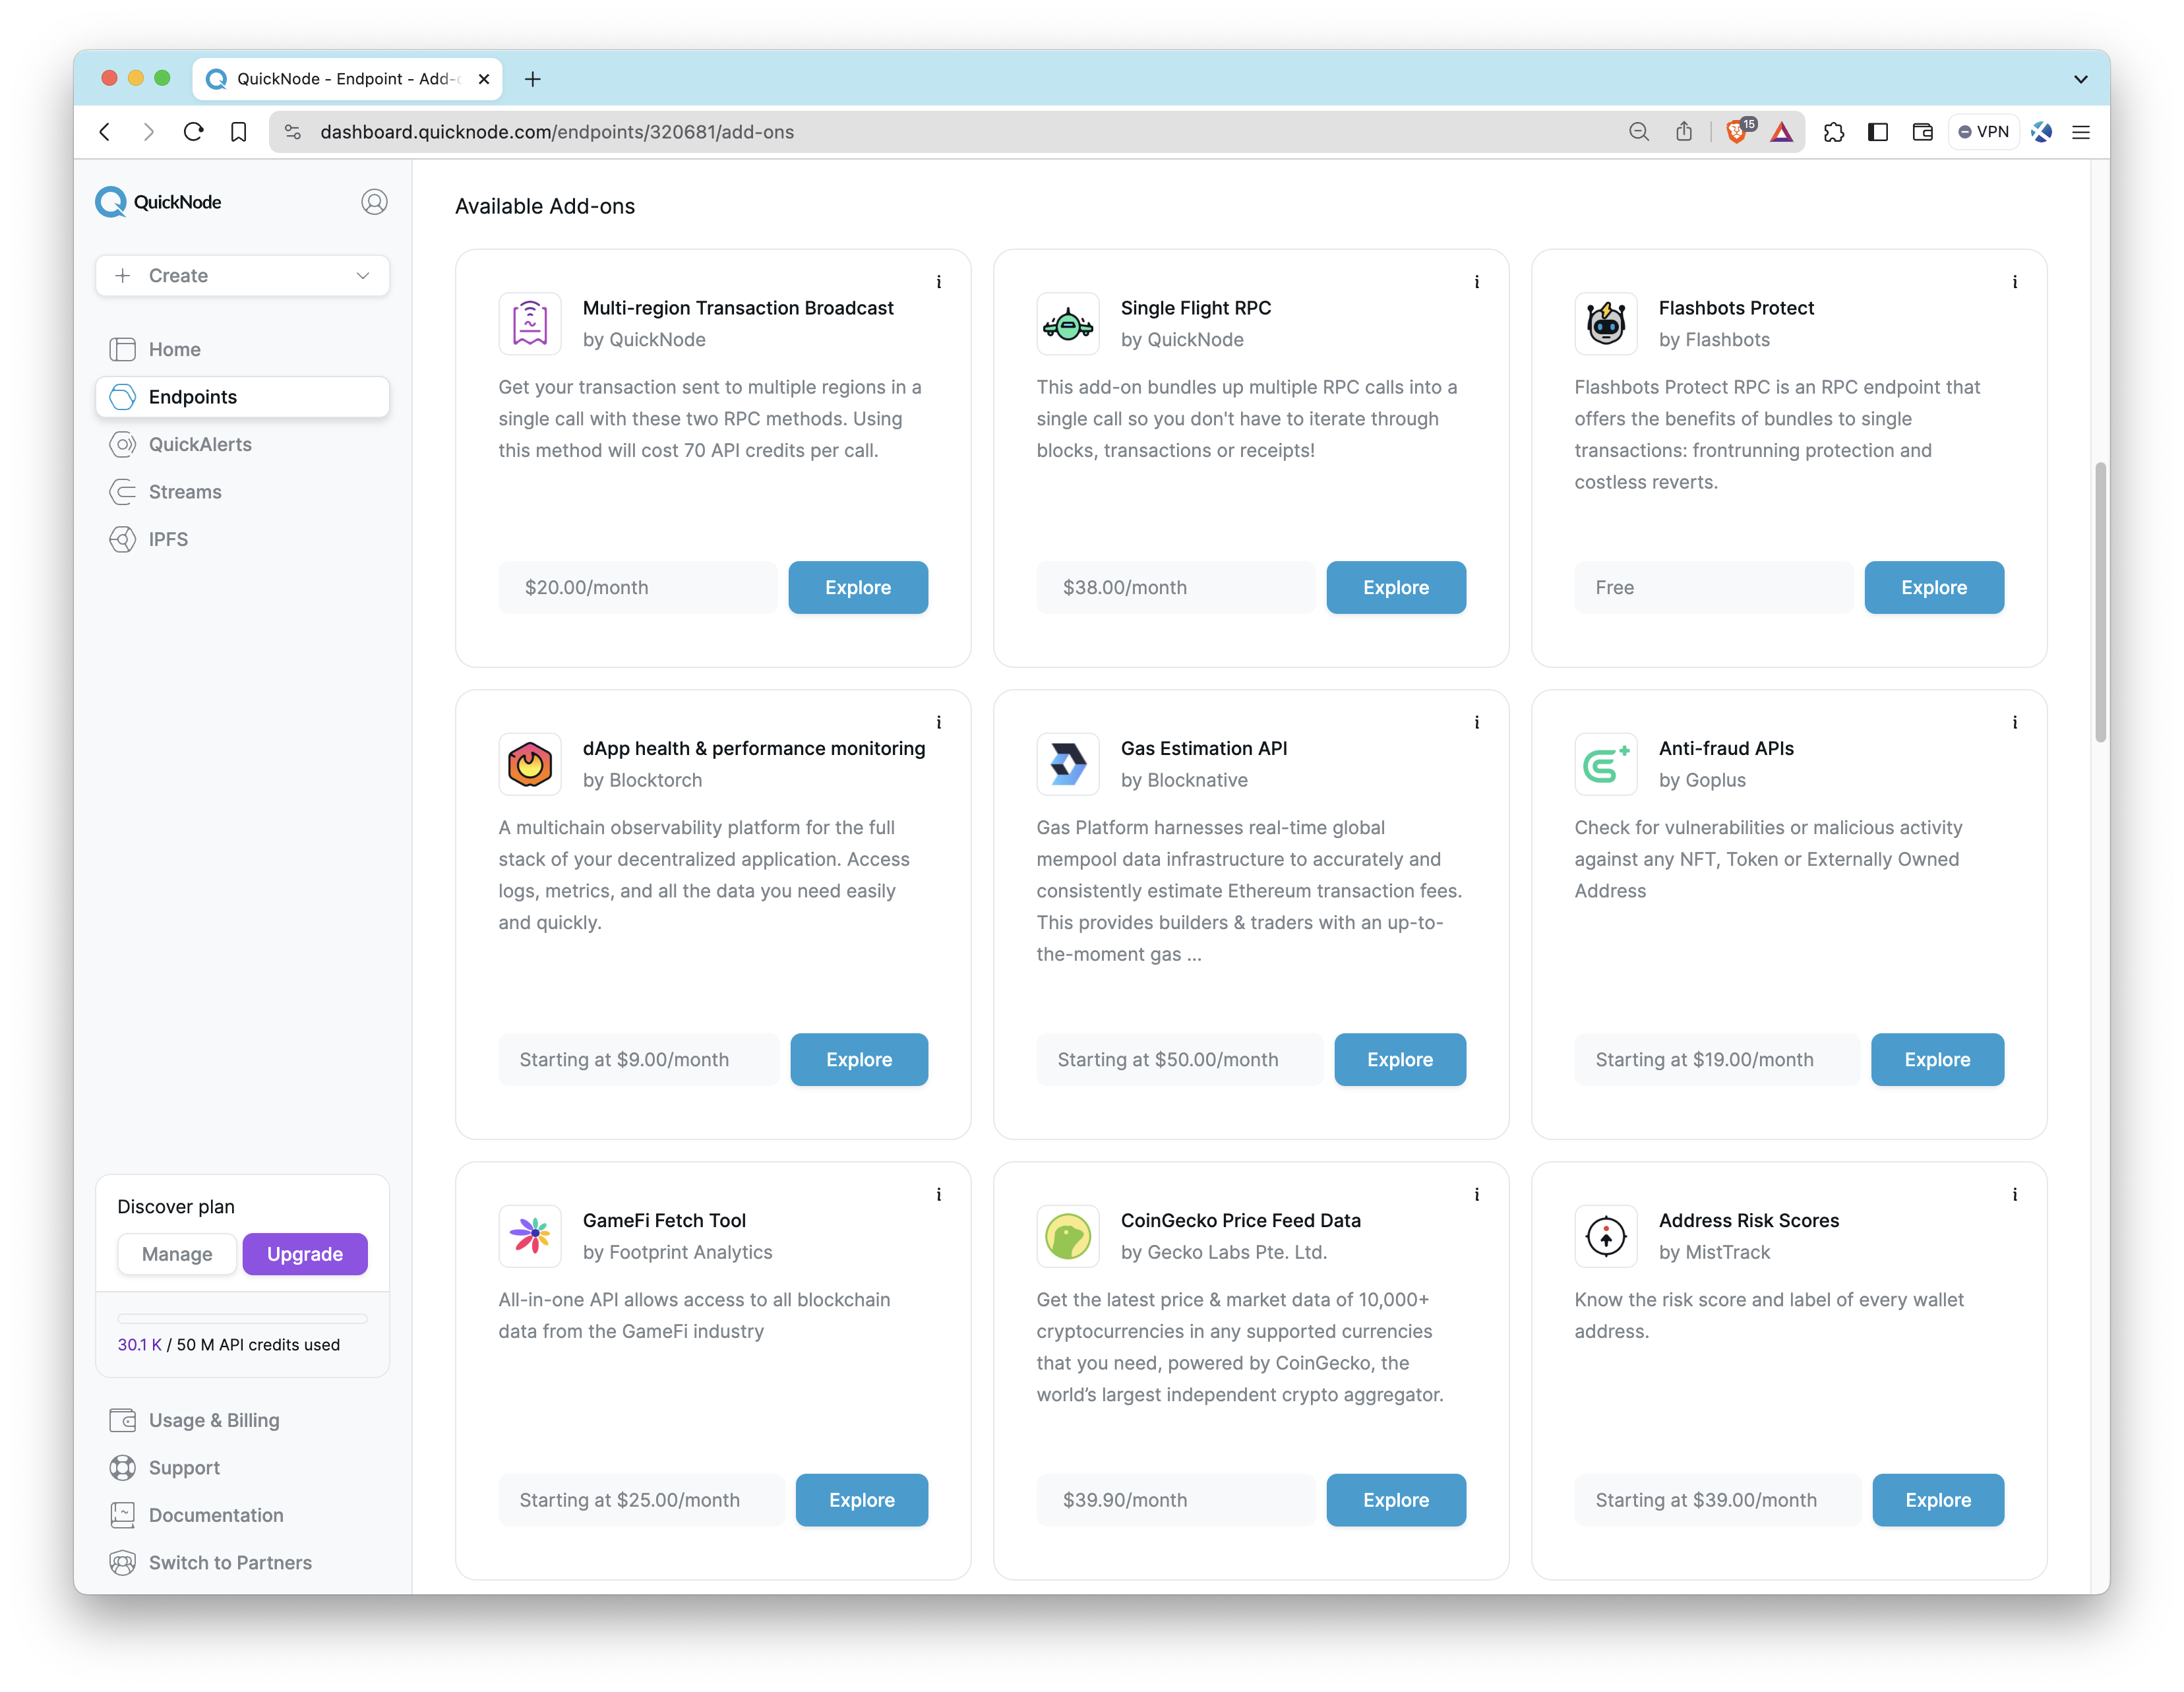
Here are a few worth considering:
- Solana Priority Fee API: Estimates Solana fees by getting real-time priority fee averages based on recent fee data.
- Metis - Jupiter Swap API: Makes lightning fast calls to Jupiter swap API via their SDK with clear and reliable rate limits.
- BTC Blockbook JSON-RPC Add-On: Gets access to balances, transactions, and UTXOs for addresses or xpubs via JSON-RPC.
- Single Flight RPC: Bundles multiple RPC calls to get full block and transaction receipts so you don't have to.
- Multi-region Transaction Broadcast: Send transactions to multiple regions in a single RPC call.
To see the full list of add-ons, check out the Quicknode Marketplace.
Streams
To receive both real-time and historical blockchain data, Streams provides a powerful solution with guaranteed delivery. Whether you need to monitor on-chain activity as it happens or backfill historical data for analysis, Streams is designed to meet your needs. Setting up is simple: choose your dataset, specify your data preferences, and Streams will continuously push data to your designated destination, such as webhooks, PostgreSQL, or Amazon S3.
Streams is available to all users with a Quicknode plan. For teams with unique requirements, we offer tailored datasets, dedicated support, and custom integrations. Contact our team for more information.
Here are a few ways you can utilize Streams:
- Monitoring real-time gas prices
- Tracking all transactions associated with a given address
- Receiving updates when a smart contract method is executed
- Backfilling historical data for comprehensive analysis
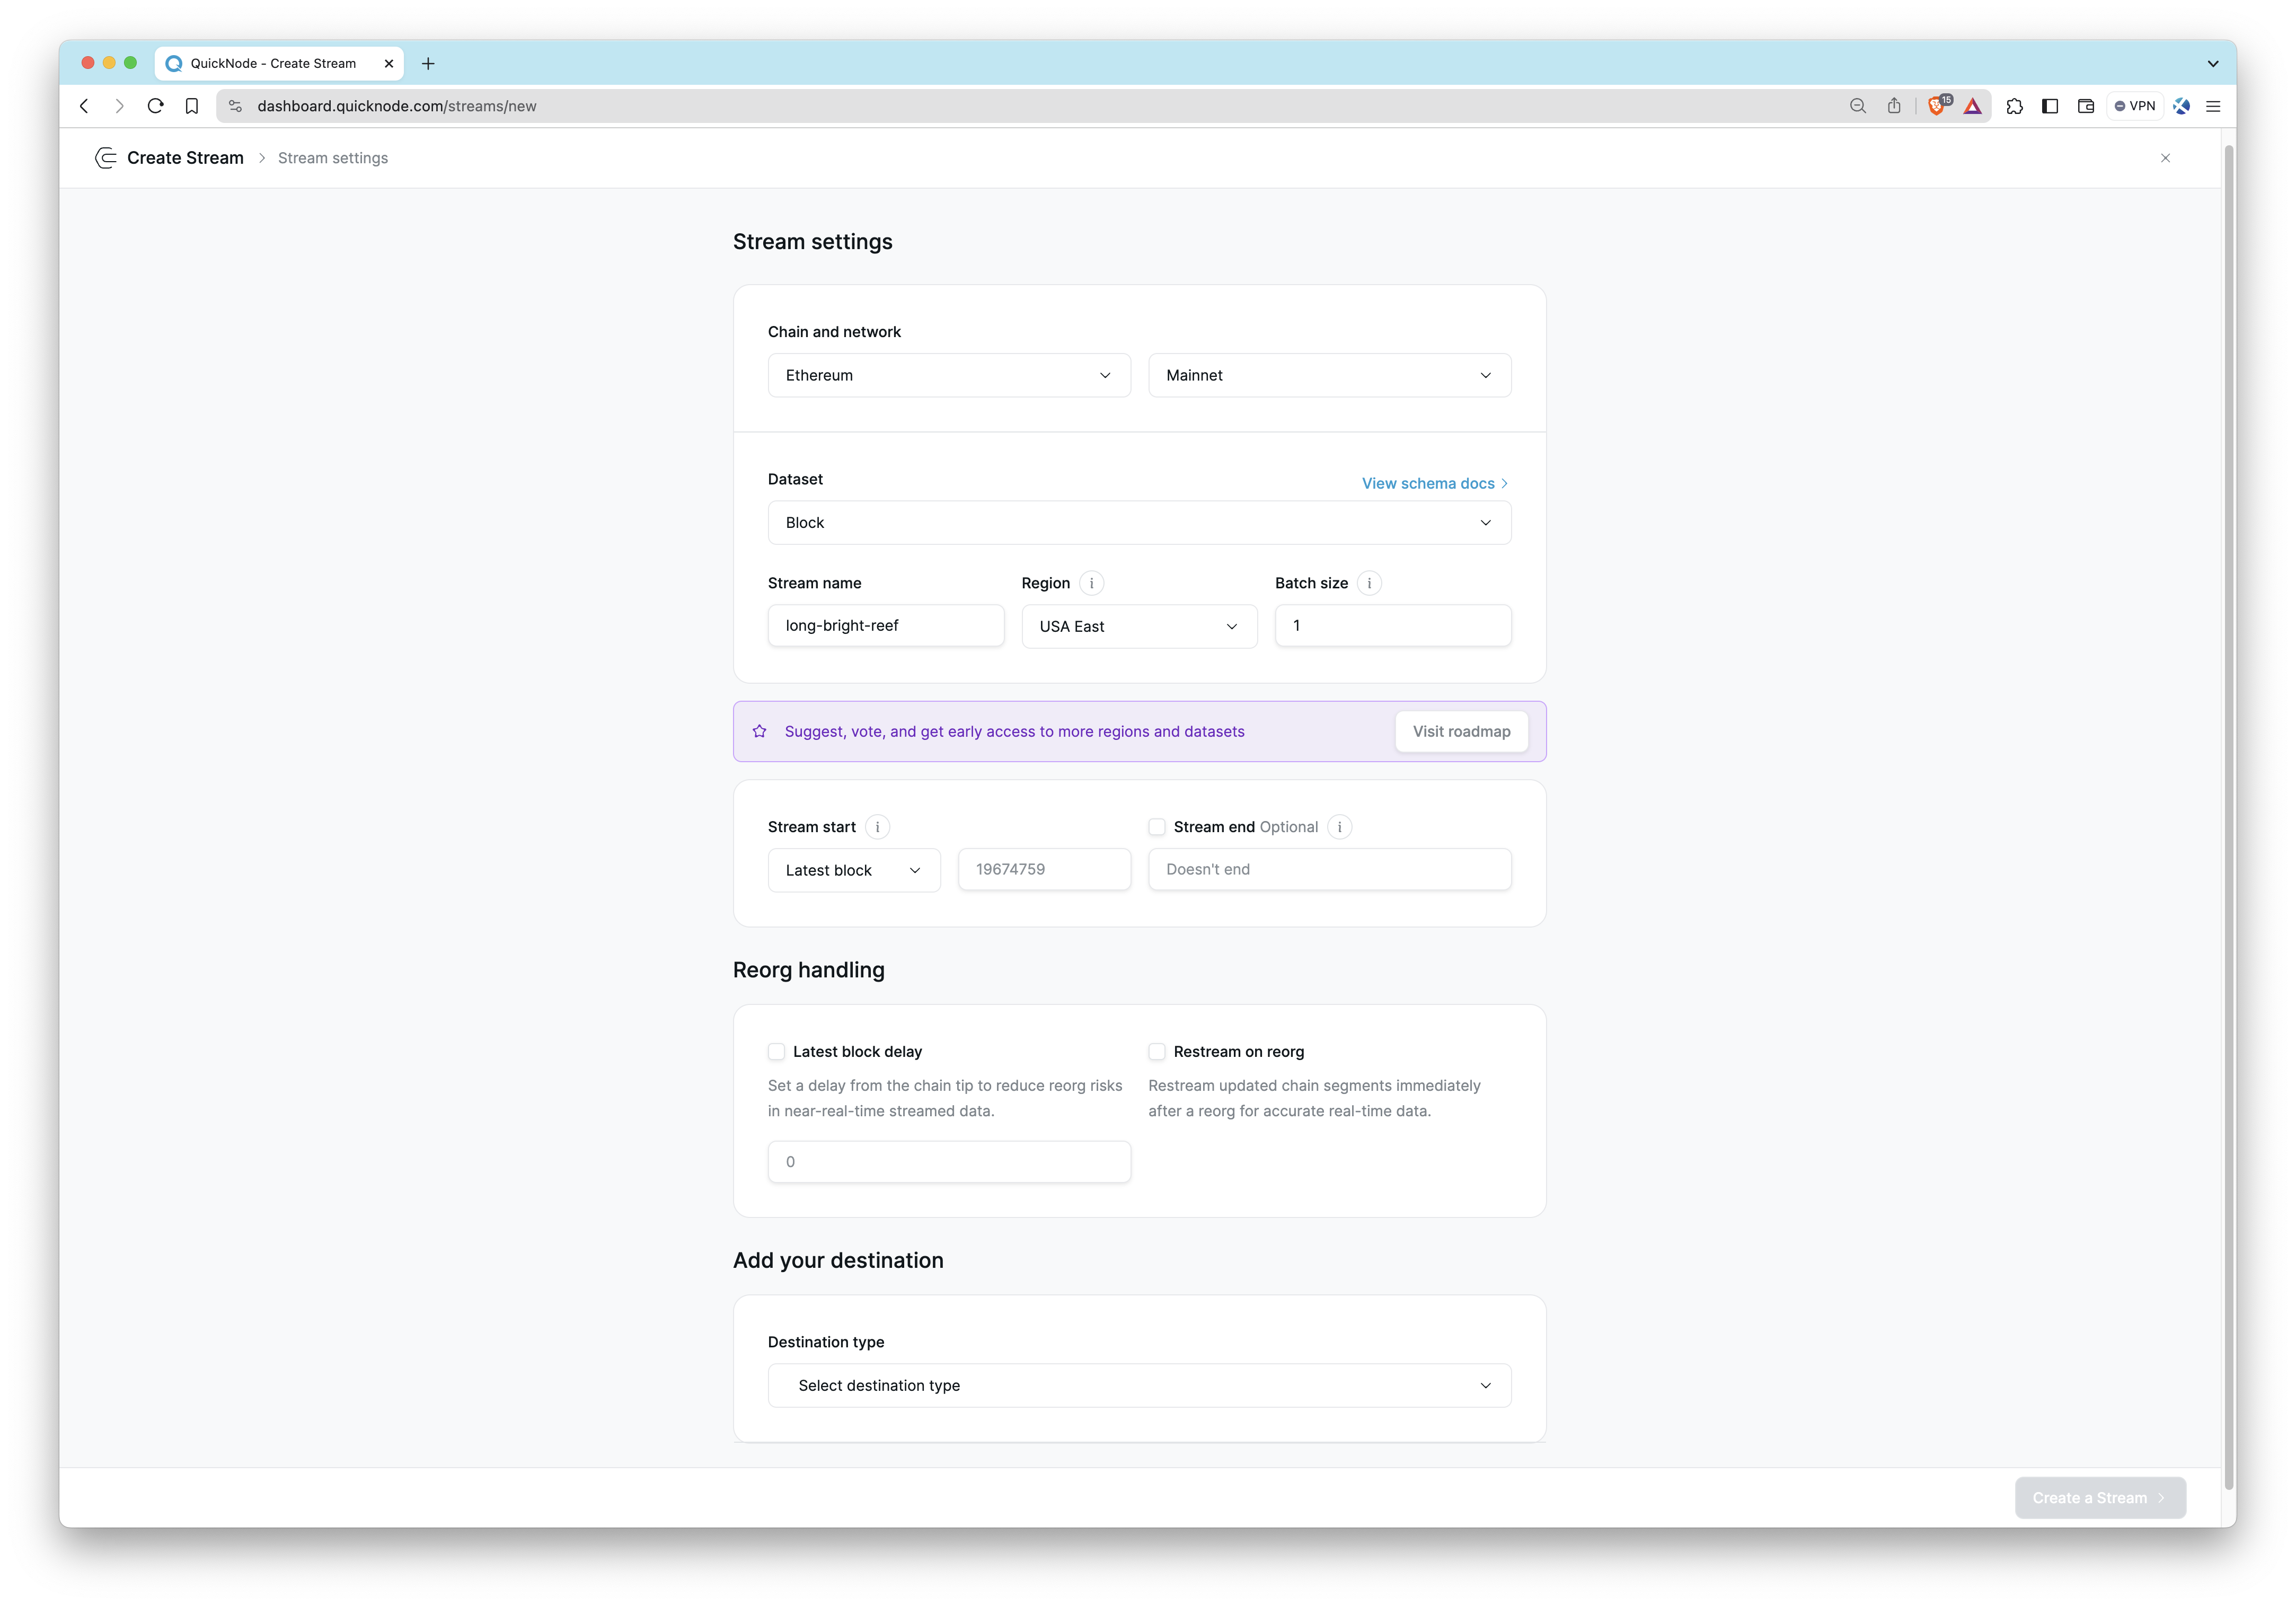
For a step-by-step guide on setting up Streams, visit our Setting Up Streams with Webhook Streams guide. To see Streams in action, visit our Streams guides.
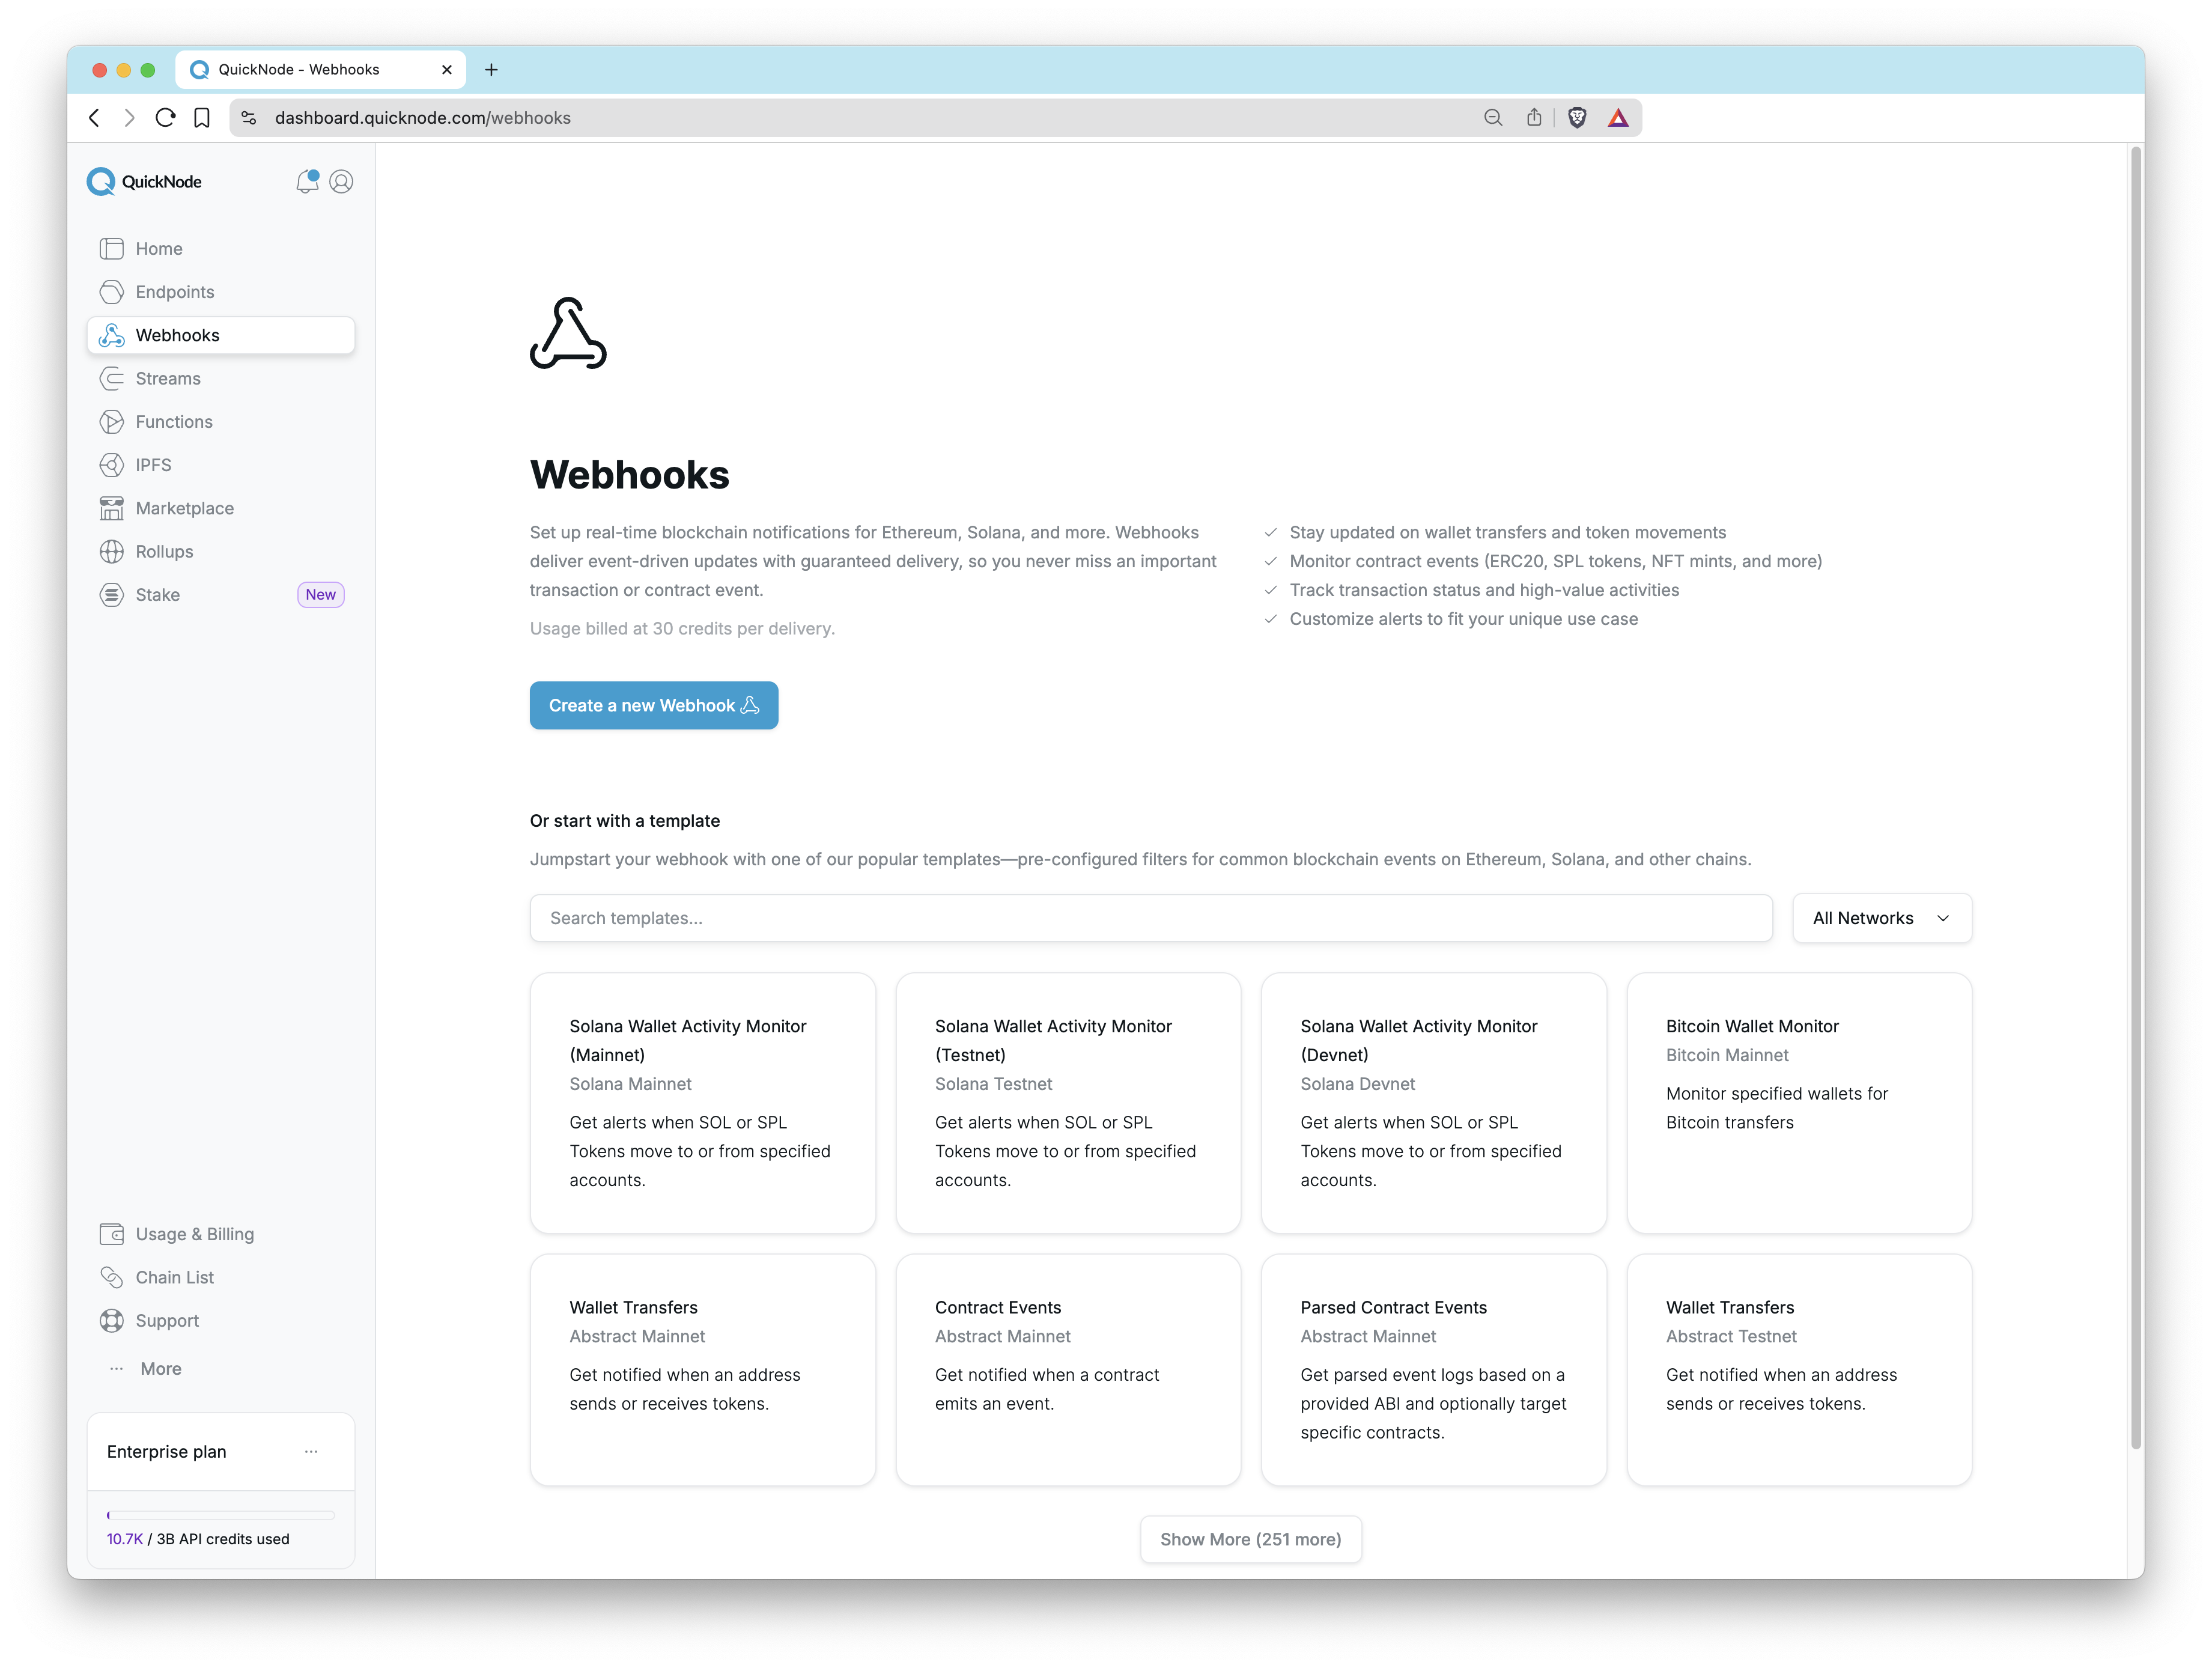
Webhooks
Webhooks is a real-time blockchain event delivery service that sends filtered on-chain data directly to your HTTP endpoints. It makes it easy to get the data you need like token transfers or contract events, without constantly polling or building complex infrastructure. When an event you're monitoring occurs, Quicknode instantly sends an HTTP POST request with the relevant data directly to your specified URL.
For a step-by-step guide, visit our Getting Started with Webhooks documentation. To see Webhooks in action, visit our Webhooks guides.
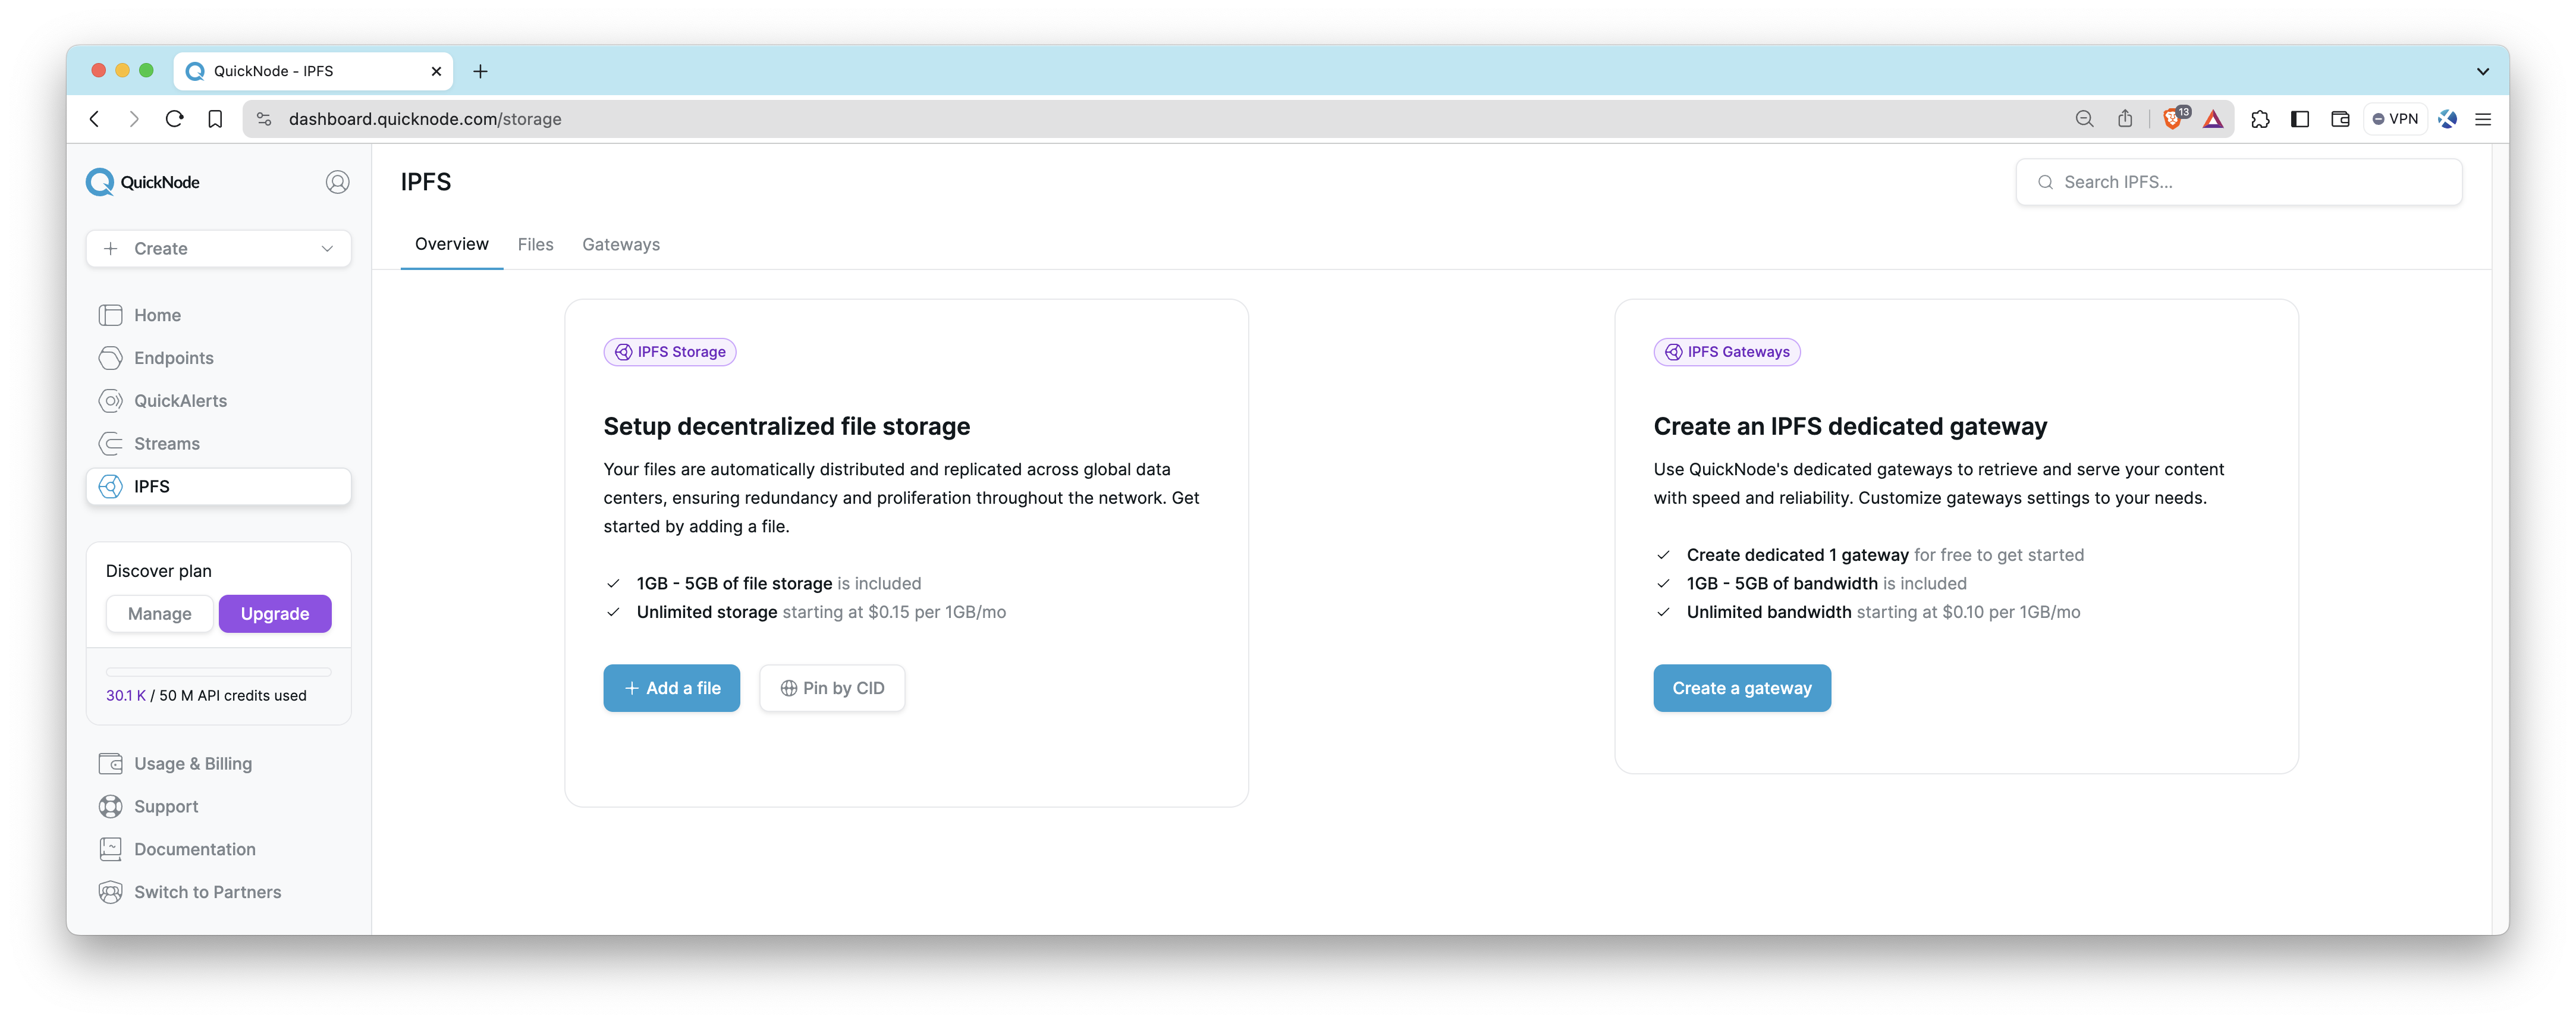
IPFS
IPFS on Quicknode offers easy pinning services and gateway access to store and share files in a decentralized manner securely and efficiently. IPFS, or InterPlanetary File System, is a protocol and network designed to create a content-addressable, peer-to-peer method of storing and sharing hypermedia in a distributed file system.
IPFS is available to all users on the Build plan. View our feature breakdown by plan on our pricing page.
IPFS is perfect for scenarios like:
- Hosting decentralized websites
- Storing metadata for NFTs
- Sharing large files without relying on a central server
- Ensuring data permanence with content addressing
Learn how to get started with IPFS on Quicknode in our IPFS documentation. To see IPFS in action and understand its practical applications, dive into our guide: How to Create and Host a Blog with IPFS using Quicknode
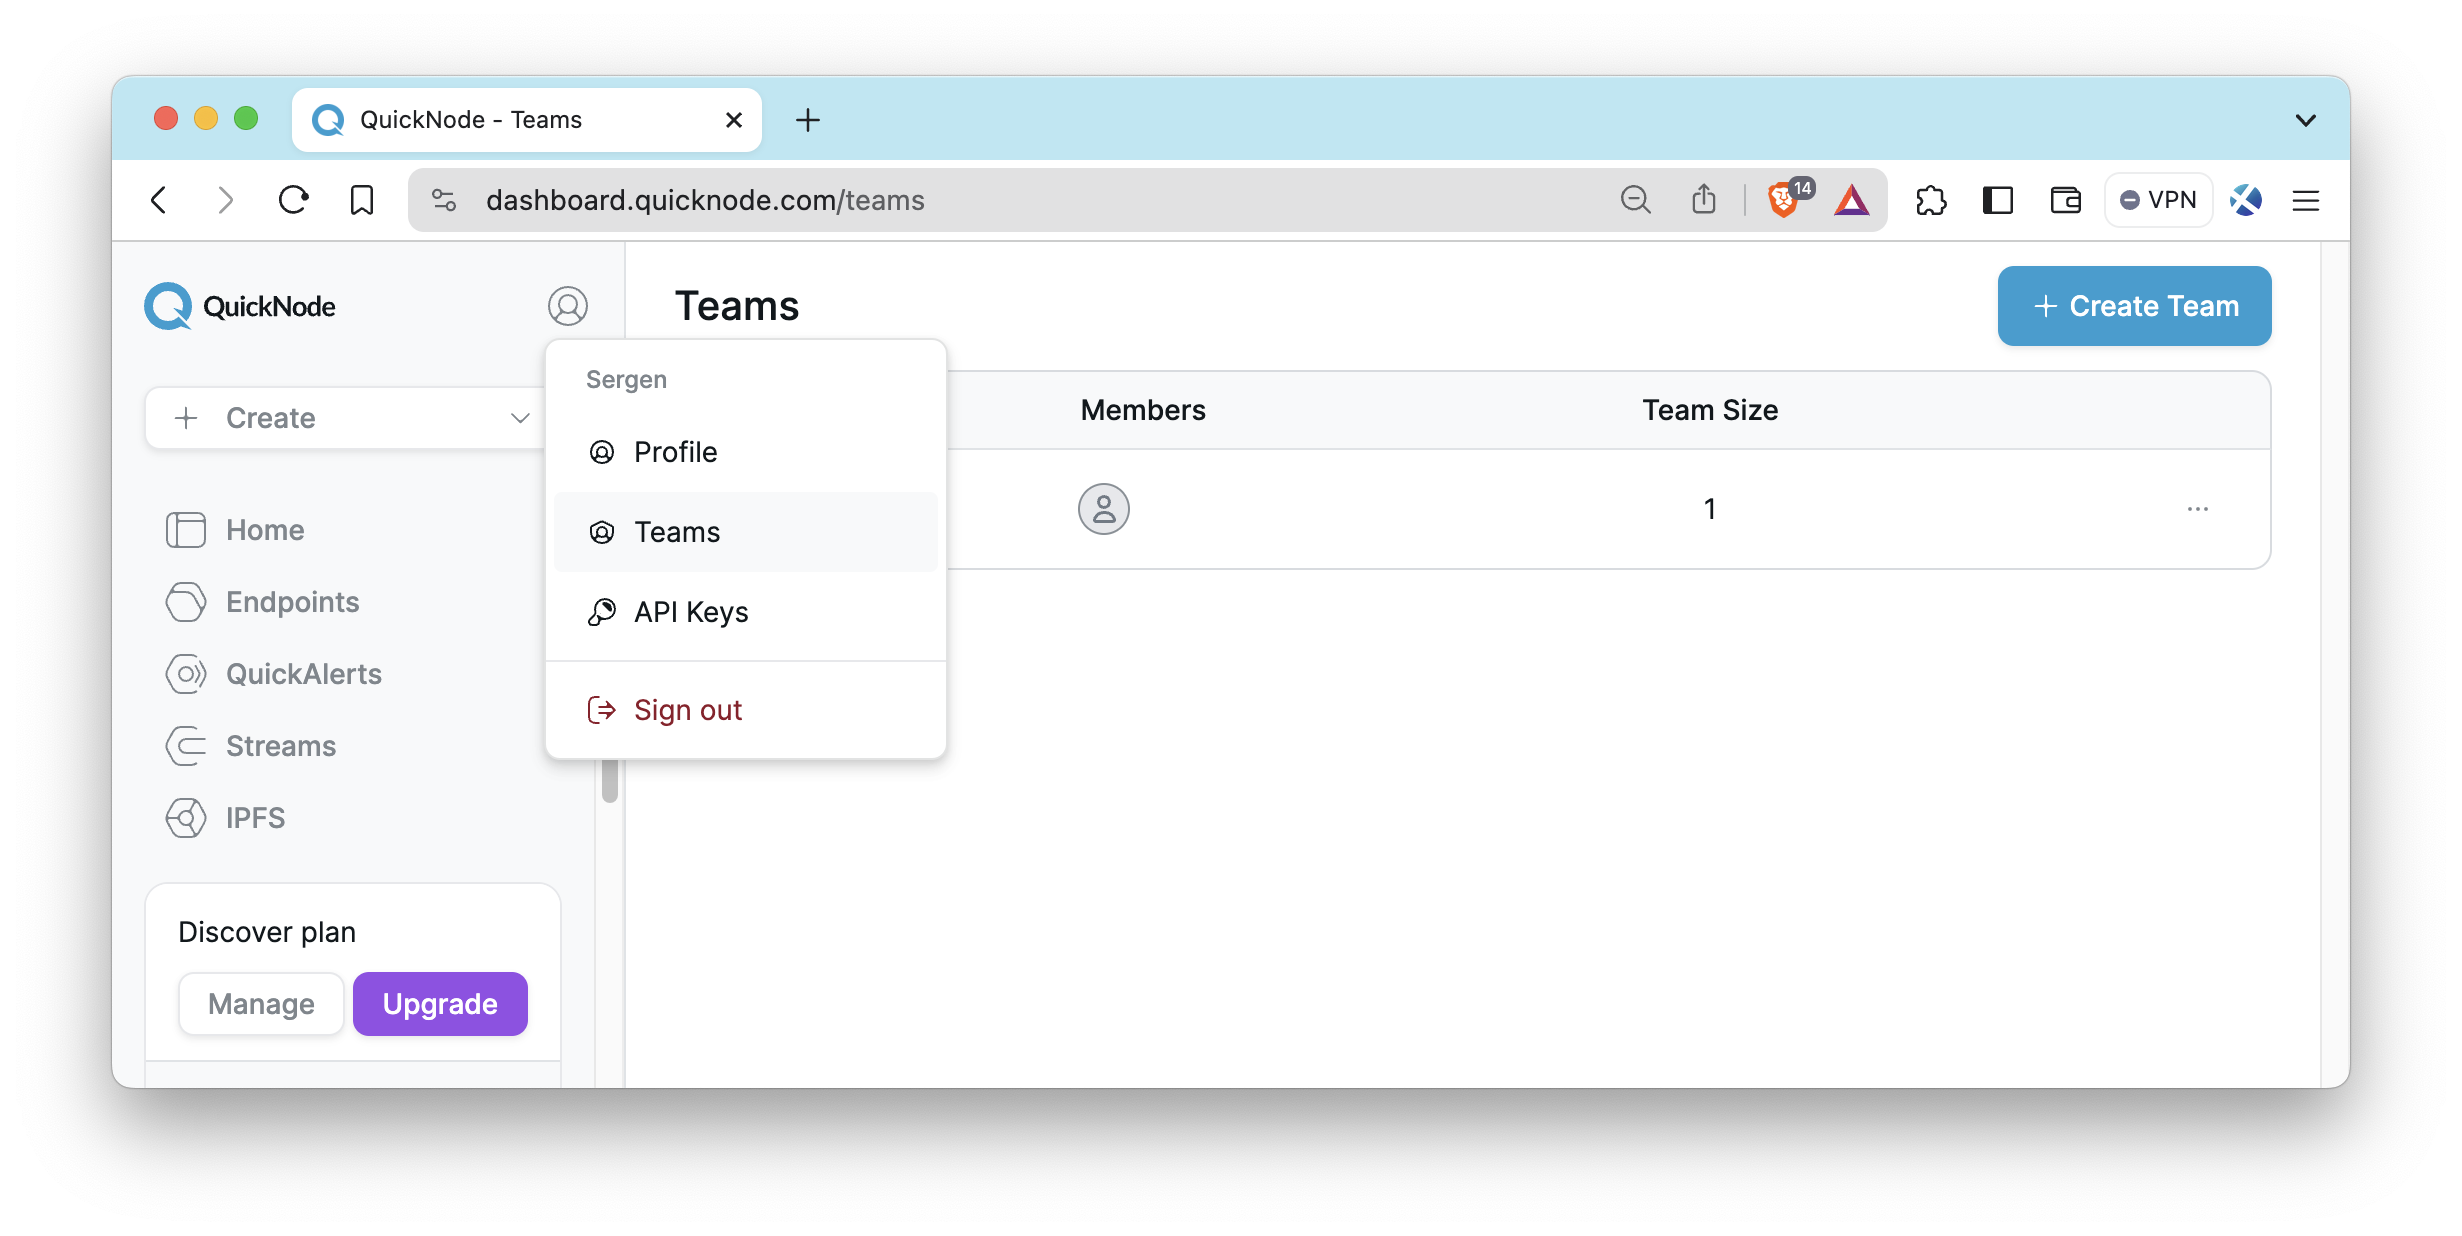
Members, Teams, and Roles
Quicknode organizes account access around three surfaces: Members, Teams, and Roles. The Members page is where Admin users manage everyone with access to your account and their roles. The Teams page is where Admin users group members to control endpoint visibility: endpoints assigned to a team are visible to that team's members. The Roles page (Enterprise only) is where Admin users create and manage custom roles with fine-grained permissions beyond the three built-in roles.
For a full walkthrough of members, teams, and Role-Based Access Control (RBAC), see our Team Management and RBAC Guide.
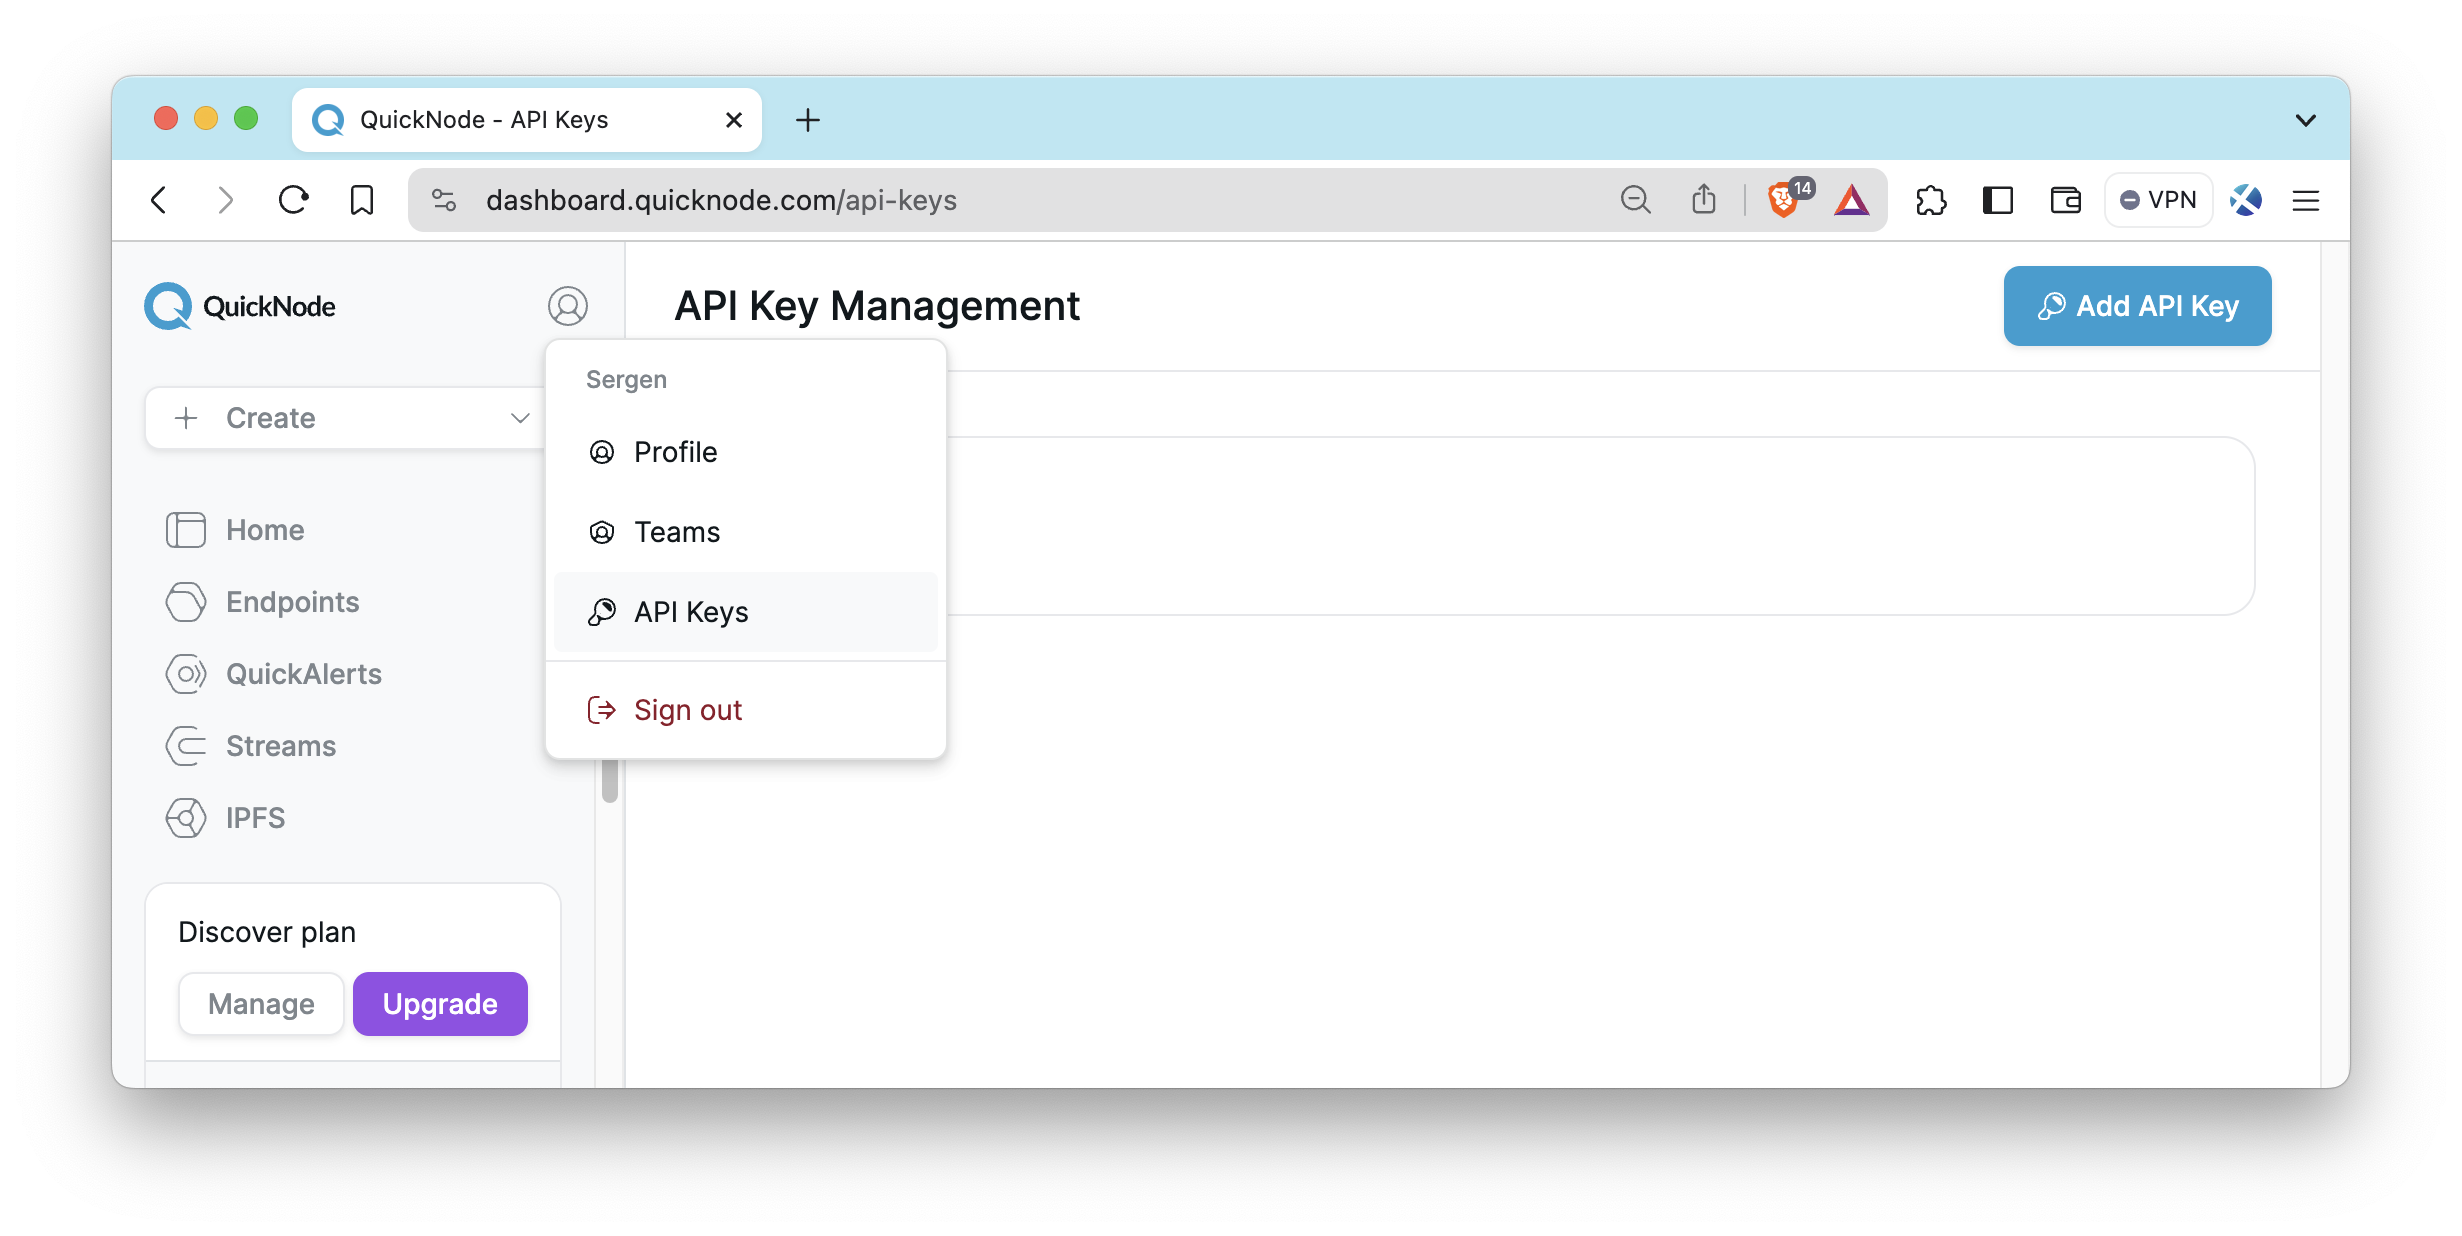
API Keys
To interact with Quicknode's services over API as opposed to the UI, Admin users can create API keys from the dashboard. These keys can be configured with access to one or many products. To create your keys, log in to your Quicknode Account, click the dropdown menu next to your account name at the bottom left, and select API Keys. It will bring you to the API Keys page.
For more information on using API keys with specific products, such as Streams, Key-Value Store, IPFS, and the Admin API, you can refer to their dedicated documentation pages.
Final Thoughts
By applying the knowledge acquired from this guide, you can create a secure, reliable, and efficient infrastructure that meets your needs. Good luck!
If you need help or want to share what you are building, let us know on Discord or Twitter.
We ❤️ Feedback!
Let us know if you have any feedback or requests for new topics. We'd love to hear from you.