11 min read
Overview
Managing RPC usage is critical for maintaining predictable costs and avoiding service interruptions. By default, Quicknode sends usage notifications emails, but many teams need more flexibility: alerts to Slack channels, integration with incident management tools like PagerDuty, notifications to multiple team members simultaneously, or visibility in existing monitoring dashboards.
This guide shows you how to build a proactive alerting system that monitors your RPC credit usage and sends multi-channel notifications before you hit your limits. The system calculates usage trends and predicts when you'll reach your credit limit, giving you time to optimize your usage or upgrade your plan.
What You Will Learn
- How to fetch RPC usage data from the Quicknode Admin API
- How to calculate usage predictions and determine alert severity
- How to configure multi-channel alerting (Slack, Discord, PagerDuty, Opsgenie, Email, Webhooks)
- How to schedule automated usage checks with cron or GitHub Actions
- How to expose metrics for Prometheus monitoring and build Grafana dashboards
What You Will Need
- A Quicknode account on any paid plan
- A Quicknode API key with
CONSOLE_RESTpermission - Node.js v18+ installed
- Access to at least one alerting channel (Slack, Discord, PagerDuty, Opsgenie, SendGrid, or a custom webhook)
Note: The Admin API is available for all paid accounts. Check pricing for details.
Why Proactive Usage Alerting?
A custom alerting solution built on the Admin API gives you powerful capabilities:
- Multi-channel delivery: Send alerts to Slack, Discord, PagerDuty, Opsgenie, or any webhook endpoint your team uses
- Predictive analysis: Know days in advance when you'll hit your limit based on current consumption trends
- Team visibility: Alert the right people on the right channels simultaneously
- Custom thresholds: Set warning and critical levels that match your operational needs
- Infrastructure integration: Connect usage data to your existing monitoring stack with Prometheus and Grafana
Understanding the Usage API
The Quicknode Admin API provides the v0/usage/rpc endpoint to retrieve your RPC credit usage data. This endpoint returns information about the time period you're querying.
API Request
curl -X GET "https://api.quicknode.com/v0/usage/rpc?start_time=START_TIMESTAMP&end_time=END_TIMESTAMP" \
  -H "x-api-key: YOUR_API_KEY_HERE" \
  -H "Content-Type: application/json"
Parameters:
start_time: Unix timestamp in seconds for the start of the period (defaults to the beginning of the current billing cycle)end_time: Unix timestamp in seconds for the end of the period (defaults to the current time)
API Response
The endpoint returns a JSON object with the following fields:
{
  "start_time": 1704067200,
  "end_time": 1705363200,
  "credits_used": 1000000,
  "credits_remaining": 4000000,
  "limit": 5000000,
  "overages": null
}
| Field | Description |
|---|---|
start_time | Unix timestamp of period start |
end_time | Unix timestamp of period end |
credits_used | Total RPC credits consumed in the billing period |
credits_remaining | Credits available before reaching your plan limit |
limit | Your plan's total credit allocation for the billing period |
overages | Credits used beyond your limit (incurs additional charges) |
With this data, the alerting system can calculate your usage percentage, predict when you'll hit your limit, and send alerts to your configured channels. Let's set up the project and explore how each component works.
Setting Up the Project
Step 1: Clone the Repository
git clone https://github.com/quiknode-labs/qn-guide-examples.git
cd qn-guide-examples/admin-api/usage-alerting
Step 2: Install Dependencies
npm install
This installs the required packages:
dotenv: Loads environment variables from a.envfiletypescript: TypeScript compilerts-node: Run TypeScript files directly
Step 3: Configure Environment Variables
Copy the example environment file and add your configuration:
cp .env.example .env
Open .env and configure your settings:
# Quicknode API Key (required)
# Get your API key from: https://dashboard.quicknode.com/api-keys
# Required permission: CONSOLE_REST
QUICKNODE_API_KEY=your_api_key_here

# Alert Thresholds (percentage of limit)
# Alerts trigger when usage >= threshold
ALERT_THRESHOLD_WARNING=80
ALERT_THRESHOLD_CRITICAL=95

# Alerting Channels (configure the ones you want to use)
# See sections below for setup instructions for each channel
SLACK_WEBHOOK_URL=
PAGERDUTY_ROUTING_KEY=
DISCORD_WEBHOOK_URL=
OPSGENIE_API_KEY=
SENDGRID_API_KEY=
SENDGRID_FROM_EMAIL=
ALERT_EMAIL_RECIPIENTS=
GENERIC_WEBHOOK_URL=
At minimum, you need to set QUICKNODE_API_KEY and configure at least one alerting channel. For testing, you can use an online webhook tester like Webhook.site or TypedWebhook for the GENERIC_WEBHOOK_URL.
Understanding the Code
The alerting system consists of three main components: fetching usage data, calculating predictions, and sending alerts. Each component is implemented as a separate function in the codebase, making it easy to understand and modify. You can find these functions in the src/index.ts file of the project.
Fetching Usage Data
The fetchUsage function retrieves your current billing period's usage data from the Admin API. It accepts optional startTime and endTime parameters to query specific time ranges, and returns the usage response including credits used, remaining credits, and your plan limit. If no time parameters are provided, it defaults to your current billing cycle.
Calculating Predictions
The calculatePrediction function analyzes your current usage rate and projects whether you'll exceed your limit. It takes the usage response from the API and calculates several useful metrics:
- Daily average: Your average credit consumption per day based on elapsed time
- Projected monthly: Estimated total usage for the billing period if current rate continues
- Days until limit: How many days until you hit your limit at the current rate
- Projected overages: Estimated credits beyond your limit
The function uses simple linear projection based on your average daily consumption, which works well for most use cases with relatively consistent usage patterns.
Determining Alert Severity
The determineAlertLevel function uses configurable thresholds to determine when to alert and at what severity. It considers both your current usage percentage and the predictions calculated above:
| Condition | Severity |
|---|---|
| Already incurring overages | Critical |
| Usage >= critical threshold (default 95%) | Critical |
| Projected to hit limit in 3 days or less | Critical |
| Usage >= warning threshold (default 80%) | Warning |
| Projected to exceed limit this month | Warning |
Configuring Alerting Channels
The project includes six pre-built alerting channels. Configure one or more based on your team's needs. These integrations serve as examples, you can easily extend the codebase to add additional channels like Microsoft Teams, Datadog, or any other service that accepts webhook payloads.
- Slack
- PagerDuty
- Discord
- Opsgenie
- Email (SendGrid)
- Generic Webhook
Slack
Slack integration uses incoming webhooks to post formatted messages to a channel.
Setup:
- Go to Slack API: Incoming Webhooks
- Create a new webhook for your workspace and channel
- Copy the webhook URL to your
.envfile:
SLACK_WEBHOOK_URL=https://hooks.slack.com/services/T00000000/B00000000/XXXXXXXXXXXXXXXXXXXXXXXX
Alert Format:
Slack alerts include color-coded attachments with usage statistics and predictions displayed in a structured layout.
PagerDuty
PagerDuty integration triggers incidents using the Events API v2.
Setup:
- In PagerDuty, go to Services and create or select a service
- Add an integration and choose "Events API v2"
- Copy the routing key to your
.envfile:
PAGERDUTY_ROUTING_KEY=your_routing_key_here
Alert Behavior:
- Critical alerts trigger P1 incidents
- Warning alerts trigger P3 incidents
- Alerts use deduplication keys to prevent duplicate incidents
Discord
Discord integration posts embedded messages to a channel.
Setup:
- In your Discord server, go to Server Settings > Integrations > Webhooks
- Create a new webhook and select the target channel
- Copy the webhook URL to your
.envfile:
DISCORD_WEBHOOK_URL=https://discord.com/api/webhooks/000000000000000000/xxxxxxxxxxxxxxxxxxxxxxxxxxxxxxxxxxxx
Opsgenie
Opsgenie integration creates alerts with appropriate priority levels.
Setup:
- In Opsgenie, go to Settings > API Key Management
- Create a new API key with "Create and Update" permissions
- Copy the API key to your
.envfile:
OPSGENIE_API_KEY=your_api_key_here
Alert Behavior:
- Critical alerts create P1 priority alerts
- Warning alerts create P3 priority alerts
- Alerts are tagged with
quicknode,usage, and severity level
Email (SendGrid)
Email integration sends HTML-formatted alerts via SendGrid.
Setup:
- Create a SendGrid account
- Go to Settings > API Keys and create a key with "Mail Send" permission
- Verify a sender email address
- Configure your
.envfile:
SENDGRID_API_KEY=SG.xxxxxxxxxxxxxxxxxxxxxxxxxxxxxxxxxxxxxxxxxxxx
SENDGRID_FROM_EMAIL=alerts@yourdomain.com
ALERT_EMAIL_RECIPIENTS=team@yourdomain.com,oncall@yourdomain.com
Multiple recipients are separated by commas.
Generic Webhook
For custom integrations, the generic webhook sends a JSON payload to any HTTP endpoint.
Setup:
GENERIC_WEBHOOK_URL=https://your-service.com/webhook/quicknode-alerts
Payload Format:
{
	"timestamp": "2024-01-15T12:00:00.000Z",
	"source": "quicknode-usage-monitor",
	"severity": "warning",
	"title": "Quicknode RPC Usage Warning",
	"message": "Your Quicknode RPC usage has reached 82.5% of your limit...",
	"data": {
		"usage_percent": 82.5,
		"credits_used": 4125000,
		"credits_remaining": 875000,
		"limit": 5000000,
		"overages": 0
	},
	"prediction": {
		"daily_average": 275000,
		"projected_monthly": 8250000,
		"projected_percent": 165.0,
		"days_until_limit": 3,
		"projected_overages": 3250000
	}
}
Running the Script
Check Mode
Run in check mode to view your usage and predictions without sending alerts:
npm run check
Example output:
Running in check mode (no alerts will be sent)

Fetching Quicknode RPC usage...

=== Quicknode RPC Usage Report ===
Period: Jan 1, 2024 - Jan 15, 2024
Days in Period:    15 elapsed, 16 remaining
----------------------------------
Credits Used:      4,125,000
Credits Remaining: 875,000
Limit:             5,000,000
Current Usage:     82.5%
----------------------------------
PREDICTIONS
Daily Average:     275,000 credits/day
Projected Monthly: 8,525,000 credits (170.5%)
Days Until Limit:  ~3 days
Projected Overage: 3,525,000 credits
==================================

Thresholds: Warning=80%, Critical=95%
Would trigger: WARNING alert
This example shows a situation where you've used 82.5% of your credits with 15 days elapsed. At the current rate, you're projected to exceed your limit in approximately 3 days.
Alert Mode
Run in alert mode to check usage and send alerts if thresholds are exceeded:
npm run dev
Or for production:
npm run build
npm start
Example output when alerts are sent:
Fetching Quicknode RPC usage...

=== Quicknode RPC Usage Report ===
Period: Jan 1, 2024 - Jan 15, 2024
Days in Period:    15 elapsed, 16 remaining
----------------------------------
Credits Used:      4,125,000
Credits Remaining: 875,000
Limit:             5,000,000
Current Usage:     82.5%
----------------------------------
PREDICTIONS
Daily Average:     275,000 credits/day
Projected Monthly: 8,525,000 credits (170.5%)
Days Until Limit:  ~3 days
Projected Overage: 3,525,000 credits
==================================

Alert level: WARNING

Sending alerts to 2 channel(s)...
  [OK] slack
  [OK] pagerduty
Scheduling Alerts
Since the Admin API is a REST service, alerts are generated when you query it, not pushed automatically. This makes scheduling essential for proactive monitoring. Without regular checks, you won't receive alerts until you manually run the script.
Schedule the script to run at an interval that matches your usage patterns and response needs. More frequent checks (every few hours) catch usage spikes early, while less frequent checks (daily) may be sufficient for predictable workloads.
Using Cron (Linux/macOS)
Add a cron job to run the check every 6 hours:
crontab -e
Add this line (adjust the path to your installation):
0 */6 * * * cd /path/to/usage-alerting && npm start >> /var/log/quicknode-alerts.log 2>&1
Using GitHub Actions
Create a workflow file at .github/workflows/usage-alerts.yml:
name: Quicknode Usage Alerts

on:
  schedule:
    # Run every 6 hours
    - cron: '0 */6 * * *'
  workflow_dispatch: # Allow manual triggers

jobs:
  check-usage:
    runs-on: ubuntu-latest

    steps:
      - name: Checkout repository
        uses: actions/checkout@v4

      - name: Setup Node.js
        uses: actions/setup-node@v4
        with:
          node-version: '20'

      - name: Install dependencies
        working-directory: admin-api/usage-alerting
        run: npm install

      - name: Run usage check
        working-directory: admin-api/usage-alerting
        env:
          QUICKNODE_API_KEY: ${{ secrets.QUICKNODE_API_KEY }}
          ALERT_THRESHOLD_WARNING: '80'
          ALERT_THRESHOLD_CRITICAL: '95'
          SLACK_WEBHOOK_URL: ${{ secrets.SLACK_WEBHOOK_URL }}
        run: npm run dev
Setting Up Secrets:
- Go to your repository's Settings > Secrets and variables > Actions
- Add the following secrets:
QUICKNODE_API_KEY: Your Quicknode API keySLACK_WEBHOOK_URL: Your Slack webhook URL (or other channel secrets)
Alternative: Prometheus AlertManager
If your team already uses Prometheus, you can skip cron-based scheduling entirely. Instead, use the Prometheus exporter included in this project and configure AlertManager to handle notifications based on metric thresholds. This approach centralizes alerting logic in your existing monitoring infrastructure.
Advanced: Prometheus Integration
For teams using Prometheus and Grafana for monitoring, this project includes a custom Prometheus exporter that exposes Quicknode usage metrics. This exporter translates the v0/usage/rpc API data into Prometheus format, allowing you to:
- Build Grafana dashboards displaying usage limits and remaining credits
- Set up Prometheus alerting rules via AlertManager
- Combine Quicknode usage metrics with other vendor metrics in a single Prometheus instance
Note: Quicknode also offers a Prometheus Exporter for Enterprise customers that exposes additional metrics like RPC requests, endpoint response status, and latency. Follow that guide to learn Prometheus fundamentals and build comprehensive Grafana dashboards. The exporter in this project focuses specifically on billing and usage metrics available to all paid plans.
How the Exporter Works
The exporter follows the standard Prometheus pattern. It runs a simple HTTP server that responds to scrape requests on-demand:
-
Passive operation: The exporter runs an HTTP server and waits for requests. It doesn't fetch data on its own schedule or run background jobs.
-
Prometheus controls timing: Prometheus is configured to scrape the
/metricsendpoint at your specified interval (e.g., every five minutes). -
On-demand fetching: When Prometheus hits the
/metricsendpoint, the exporter calls the Quicknode API, formats the response as Prometheus metrics, and returns it. -
Stateless design: The exporter doesn't cache or store data between requests. Each scrape returns fresh data from the API.
This design means you control the scrape frequency entirely through your Prometheus configuration. Adjust the scrape_interval based on how frequently you need updated metrics.
Starting the Exporter
npm run exporter
This starts a metrics server on port 9091 (configurable via EXPORTER_PORT):
Quicknode Prometheus Exporter running on http://localhost:9091
Metrics endpoint: http://localhost:9091/metrics
Health endpoint:  http://localhost:9091/health
Available Metrics
| Metric | Type | Description |
|---|---|---|
quicknode_credits_used | gauge | Total RPC credits used in current billing period |
quicknode_credits_remaining | gauge | RPC credits remaining in current billing period |
quicknode_credits_limit | gauge | Total RPC credit limit for billing period |
quicknode_usage_percent | gauge | Percentage of RPC credit limit used |
quicknode_overages | gauge | RPC credits used beyond the limit |
quicknode_exporter_scrape_success | gauge | Whether the last scrape was successful |
Prometheus Configuration
Add the exporter as a scrape target in your prometheus.yml:
scrape_configs:
  - job_name: 'quicknode-usage'
    scrape_interval: 5m
    static_configs:
      - targets: ['localhost:9091']
If you're running Prometheus in Docker and the exporter on your host machine, update the target to use host.docker.internal:9091 and add the following extra_hosts to your Docker Compose file:
services:
  prometheus:
    image: prom/prometheus:latest
    extra_hosts:
      - "host.docker.internal:host-gateway"
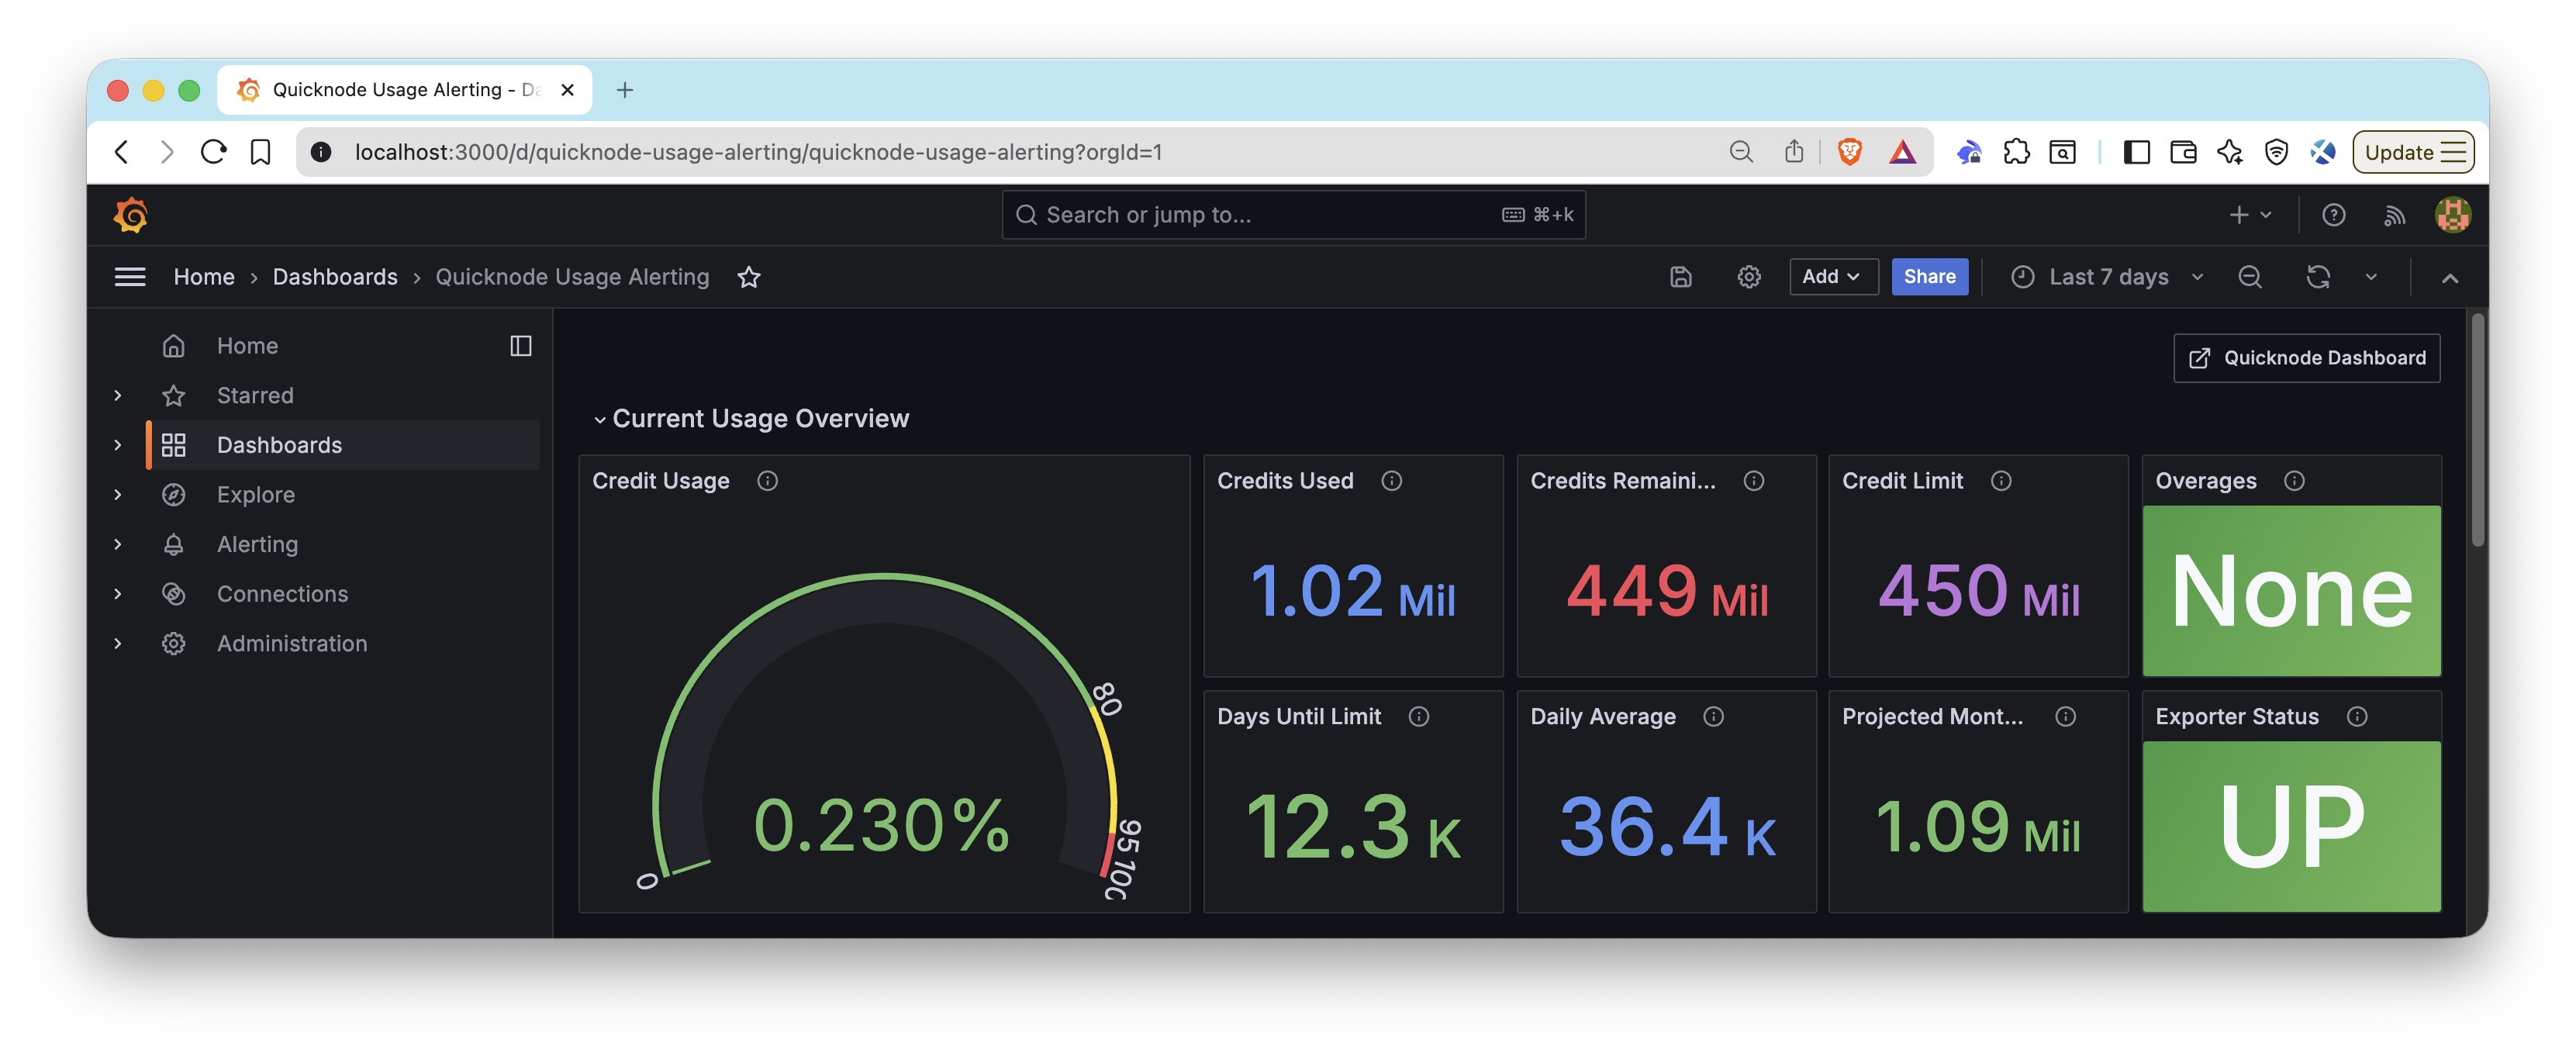
Building Dashboards
For a complete guide on building Grafana dashboards with Quicknode metrics, see our guide: How to Build a Grafana Dashboard to Monitor Your RPC Infrastructure.
The companion repository includes pre-built dashboard configurations:
- Usage alerting dashboard: Find the Grafana dashboard JSON at
admin-api/usage-alerting/dashboards/quicknode-usage-alerting-grafana.json. Import this directly into your Grafana instance or place it in your provisioning folder. - Full monitoring stack: The
admin-api/grafana-dashboarddirectory includes Docker Compose setup for a complete Prometheus and Grafana monitoring stack.
Conclusion
You've now set up a proactive alerting system for your Quicknode RPC usage. With this system, you can:
- Monitor usage across your entire organization
- Receive alerts on the channels your team actually uses
- Predict when you'll hit your limits before it happens
- Avoid surprise overage charges
The combination of multi-channel alerting and usage predictions gives you the visibility needed to manage your RPC infrastructure effectively.
Next Steps
Now that you have usage alerting in place, consider these enhancements:
- Build comprehensive dashboards: Follow our Grafana Dashboard guide to visualize usage trends over time
- Manage infrastructure programmatically: Use the Admin API to automate endpoint management alongside usage monitoring
- Review your plan limits: Check Quicknode Pricing to understand your options if you're consistently approaching your limits
- Explore the full Admin API: Review the Admin API Documentation for additional endpoints and capabilities
Frequently Asked Questions
How can I check my current Quicknode RPC credit usage programmatically?
Use the Admin API with a GET request to https://api.quicknode.com/v0/usage/rpc, including your API key, to retrieve credits_used, credits_remaining, and limit for your current billing period.
What is the Admin API used for in Quicknode?
The Admin API allows programmatic management of all actions in Quicknode, including creating, updating, and deleting endpoints, setting rate limits, and fetching detailed usage data like credits by endpoint, method, or blockchain.
How do I integrate Quicknode usage metrics with Prometheus and Grafana?
The project includes a custom Prometheus exporter that exposes Quicknode usage metrics on a /metrics endpoint. Run the exporter with npm run exporter, configure Prometheus to scrape it, and import the provided Grafana dashboard JSON to visualize credits used, remaining, usage percentage, and overages.
What alerting channels does this usage monitoring system support?
The system supports six pre-built channels: Slack, Discord, PagerDuty, Opsgenie, Email (via SendGrid), and generic webhooks. You can configure one or more channels and extend the codebase to add additional integrations.
Can I break down RPC credit usage by endpoint or method?
Yes, use GET requests to /v0/usage/rpc/by-endpoint or similar endpoints to view detailed breakdowns of credit consumption across endpoints, methods, or blockchains.
If you have questions or run into issues, reach out in our Discord. Stay up to date with the latest by following us on Twitter (@Quicknode) or our Telegram announcement channel.
We ❤️ Feedback!
Let us know if you have any feedback or requests for new topics. We'd love to hear from you.