How USDC Yield Platforms Calculate APY, Explained Across 5 Platforms
How USDC Yield Platforms Calculate APY, Explained Across 5 Platforms
Why do USDC yield rates change? Explore how major DeFi platforms calculate APY and what determines the return depositors actually earn.

November 12, 2026 — 10 min read
USDC has no native yield. Neither does a dollar or a euro.
Yet somewhere along the way, earning interest or yield on money became an everyday expectation.
Banks, governments, and stablecoins have made this return familiar. But that return, whether you call it yield or interest, has to come from somewhere.
USDC earns yield when capital gets put to work. Borrowers pay interest, lending markets collect fees, and protocols distribute returns to depositors.
That is the visible part of earning USDC yield. The more impactful part is the math behind the yield number.
Part 1 covered where USDC earns yield. Part 2 follows the rate itself, from the mechanism that sets it to the return depositors actually earn.
How the Largest USDC Yield Platforms Calculate APY
USDC yield begins with a source of revenue: how much a borrower pays for capital. Protocols then apply their own math and logic to turn that revenue into returns for depositors.
Let’s line up the top USDC yield platforms and see how each one calculates yield.
Venue | Rate-setting mechanism | Who funds the yield? | What changes the return? | How yield reaches depositors |
|---|---|---|---|---|
Aave V3 | Two-slope utilization curve | Collateralized borrowers paying USDC interest | Borrowing demand, deposits, withdrawals, and reserve factor | aUSDC balance grows |
Compound V3 | Independent supply and borrow curves | Collateralized borrowers paying USDC interest | Utilization and governance-configured curve parameters | Supplier balance accrues through the supply index |
Morpho | Adaptive interest rate curve plus vault allocation | Borrowers in isolated lending markets | Utilization, time spent away from target, and vault allocations | Vault share value rises |
Spark | Governance-set savings rate | Revenue from lending and investment strategies | Governance decisions, funding conditions, and strategy returns | Savings token or vault share value rises |
Maple | Negotiated institutional loan rates | Institutional borrowers paying loan interest | Loan terms, deployed capital, fees, and credit performance | syrupUSDC share value rises |
Now, let’s break down each mechanism and understand the calculation from scratch.
Before we move forward, it helps to understand one key distinction: APR versus APY.
APR is the annualized interest rate before compounding.
APY accounts for compounding over a year, so it is typically higher when interest accrues more than once.
Note: Unless stated otherwise, rates in this section are APR, not APY.
Utilization Curves: Aave V3 and Compound V3
Aave V3 and Compound V3 calculate USDC lending rates based on utilization: the percentage of deposited USDC currently borrowed.
At 80% utilization, $80 million of a $100 million pool is lent out, and $20 million remains available for withdrawals and new loans.
As utilization increases, borrowing becomes more expensive and depositors generally earn higher rates.
How Aave V3 Calculates USDC Yield APY
Aave bases the depositor rate on the interest borrowers pay. The calculation has three inputs:
Supply APR = Borrow APR × Utilization × (1 − Reserve Factor)
Utilization measures how much of the pool’s supplied USDC has been borrowed.
The reserve factor is the share of borrowing interest Aave sets aside for protocol reserves.
Take a pool with a 4.50% borrow APR, 94% utilization, and a 10% reserve factor:
4.50% × 94% × 90% = 3.81%
Depositors receive a 3.81% supply APR. But the 4.50% borrow APR is not fixed. It changes with pool utilization.
Aave uses a two-slope interest rate model to price borrowing.
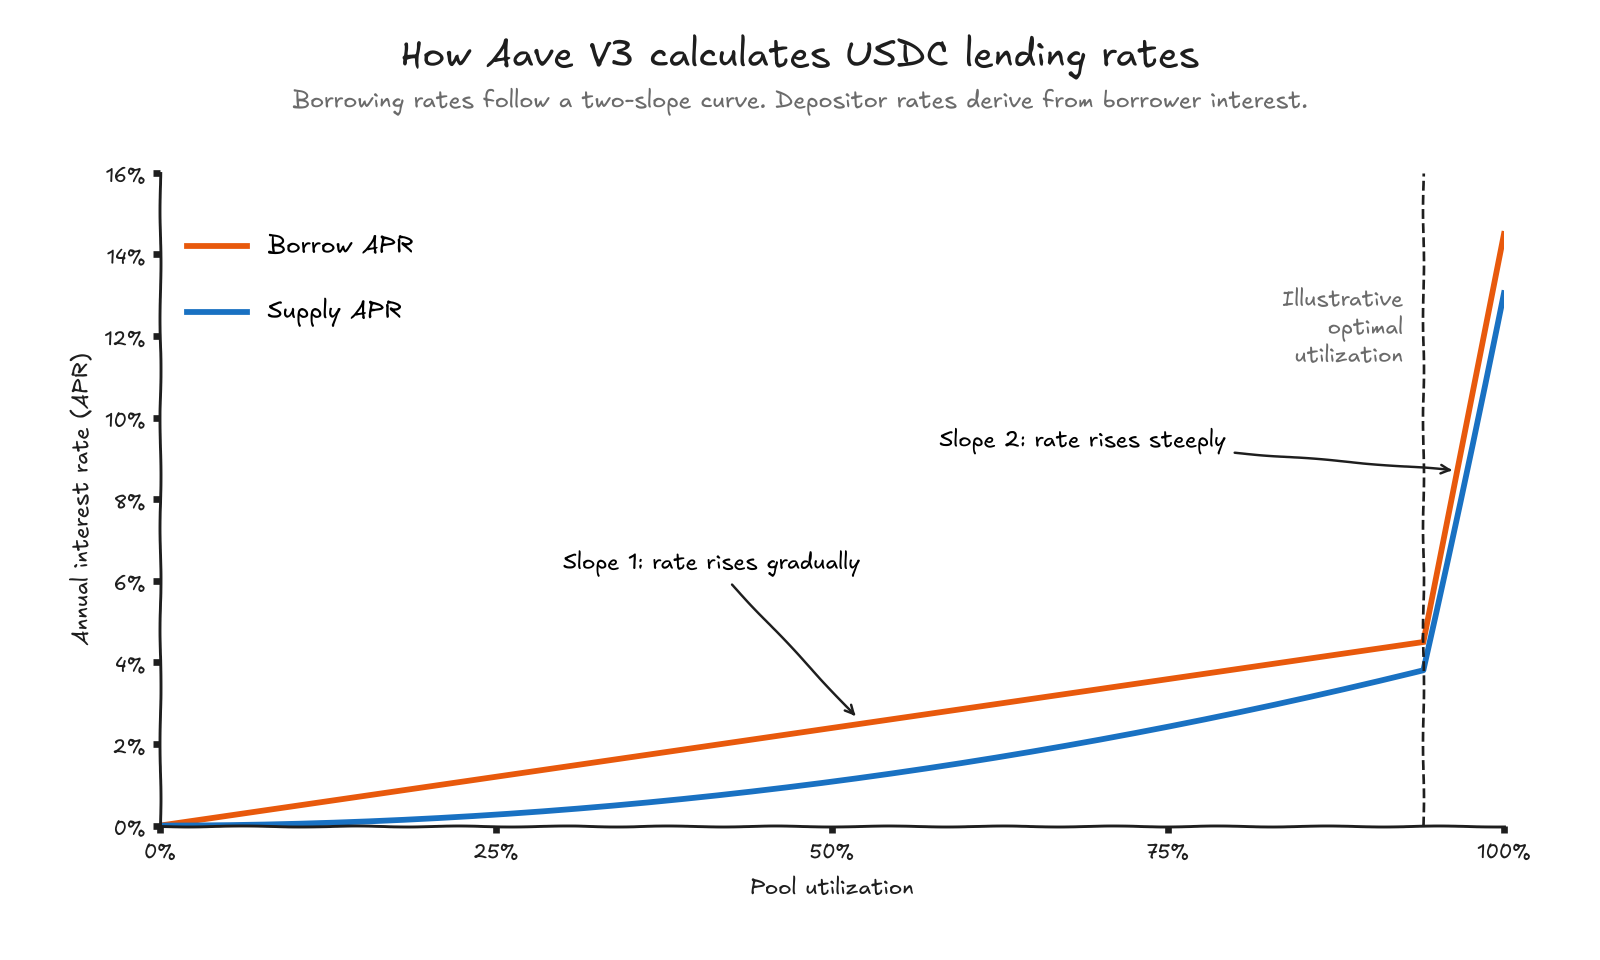
Below the optimal utilization threshold, rates rise gradually. At the threshold, known as the kink, the curve steepens sharply and makes borrowing more expensive.
The higher rate also makes USDC deposits more attractive and helps restore available liquidity.
The supply rate follows the same curve indirectly. As borrowing rates rise, more interest becomes available to depositors.
Aave tracks accrued interest through its liquidity index, increasing aUSDC balances as interest accumulates.
Now, let’s move to Compound V3.
How Compound V3 Calculates USDC Yield APY
Compound V3 also uses utilization curves to calculate APY, but with one difference from Aave: Compound calculates supply and borrow rates independently.
Each curve has its own base rate, utilization threshold (kink), and slopes set by governance.
For depositors, the calculation follows a simple rule:
Supply APR = Base Supply Rate + Interest Determined by Utilization
The base supply rate is the starting point. As more USDC gets borrowed, the supply APR increases along the configured curve.
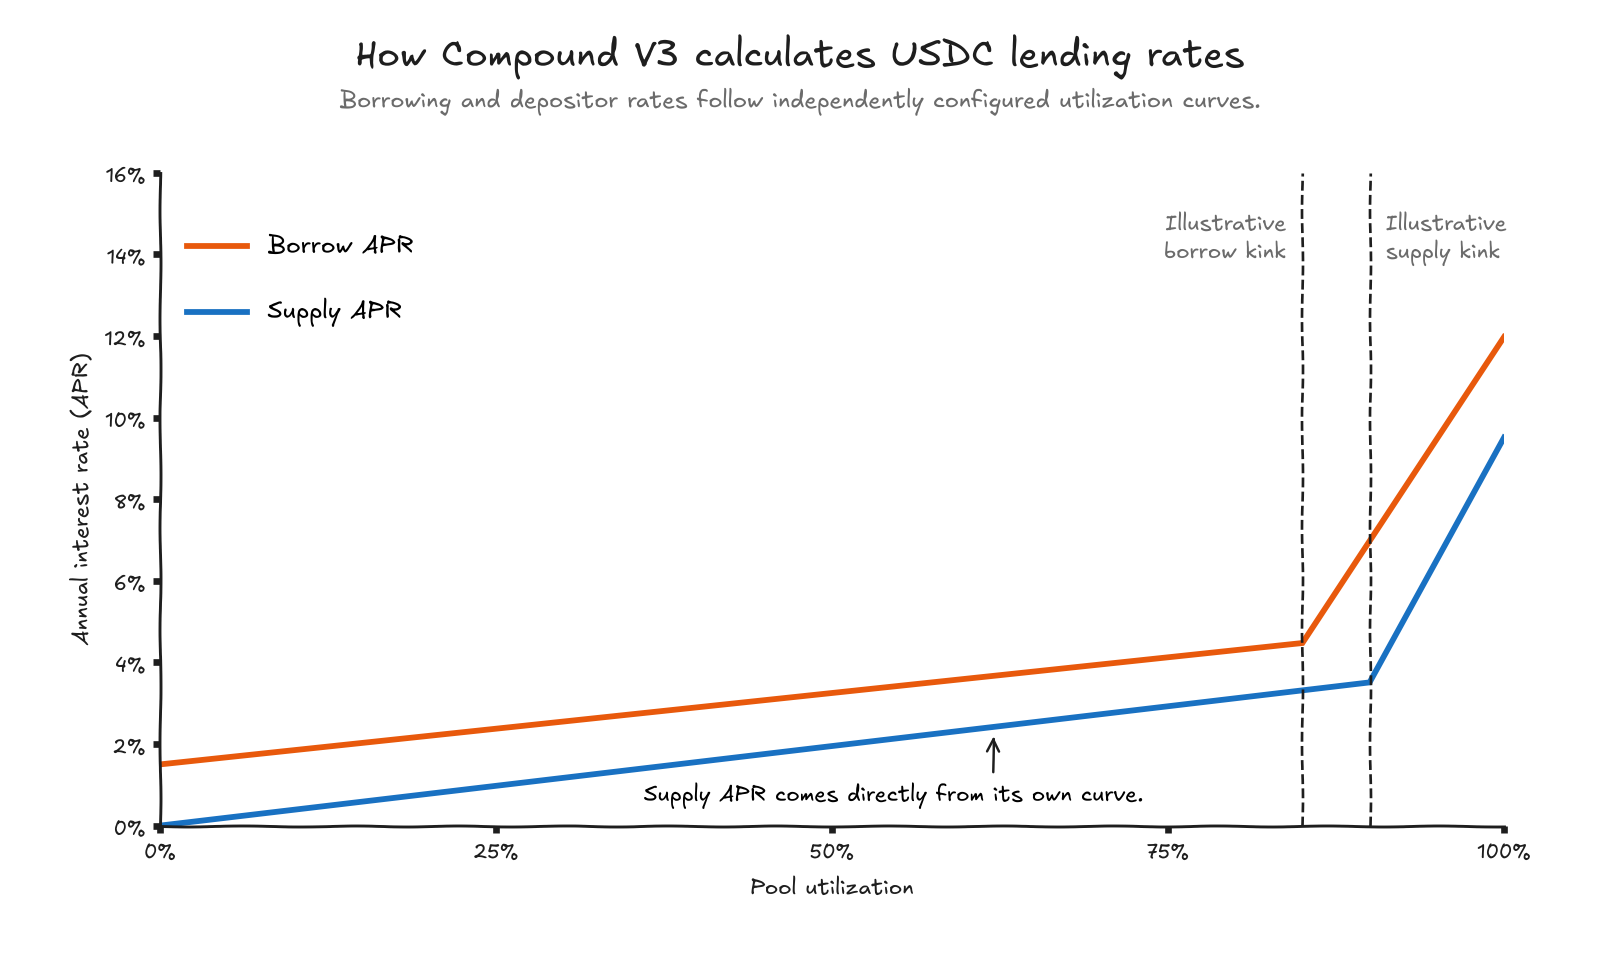
Each curve steepens beyond its own kink. Since the parameters differ, borrowing and supply rates can rise at different speeds.
Compound accrues depositor interest through its baseSupplyIndex, increasing USDC balances over time.
Adaptive Curves: How Morpho Calculates USDC Yield
Morpho’s AdaptiveCurveIRM adjusts borrowing rates automatically, without governance intervention. It targets 90% utilization through two mechanisms:
Immediate: Rates move along the existing curve as utilization changes.
Over time: Sustained utilization above or below 90% shifts the entire curve upward or downward.
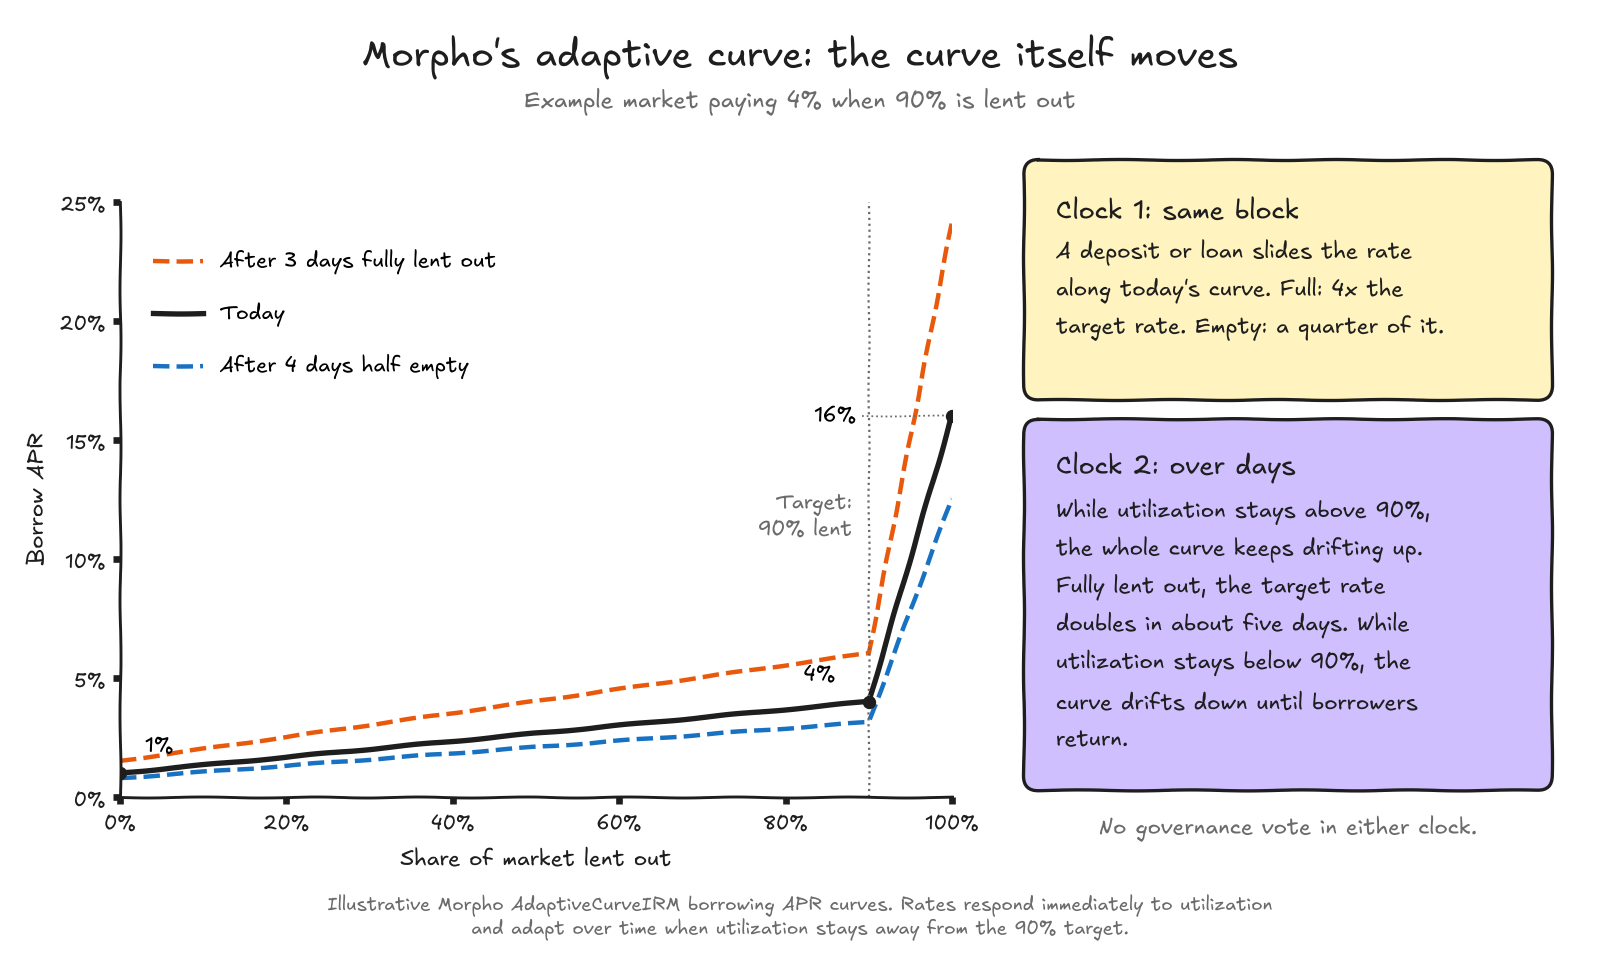
The chart starts with a 4% borrow APR at 90% utilization. At 100%, the rate jumps to 16%.
If the market remains fully borrowed, the curve keeps shifting upward, making borrowing progressively more expensive.
The reverse happens when utilization stays below 90%. Rates gradually fall to encourage borrowing.
Morpho converts borrower interest into depositor yield using:
Supply APR = Borrow APR × Utilization × (1 − Market Fee)
Vaults add another layer. They can allocate USDC across multiple markets, so the final yield depends on each market’s rate and allocation, idle capital, and vault fees.
Interest accrues to depositors through an increase in the vault share value.
Governance-Set Rates: How Spark Savings Calculates USDC Yield
Spark offers USDC yield through spUSDC, a savings vault powered by the Spark Liquidity Layer (SLL). The SLL deploys capital across DeFi lending markets and other yield-generating strategies.
Spark Governance sets the Vault Savings Rate (VSR) based on underlying returns and market conditions.
More importantly, Spark does not automatically recalculate depositor rates whenever utilization changes.
Depositors receive spUSDC shares when they deposit USDC. As yield accrues, each share becomes redeemable for more USDC.
Disclaimer: Actual earnings depend on the savings rates in effect throughout the deposit period.
Negotiated Credit: How Maple Calculates USDC Yield
Maple calculates USDC yield from interest paid on institutional loans. Loan rates are negotiated with borrowers rather than determined by utilization curves or governance-set savings rates.
However, the rate borrowers pay is not necessarily what depositors earn. The final return depends on how much capital is deployed, the interest collected, and applicable fees.
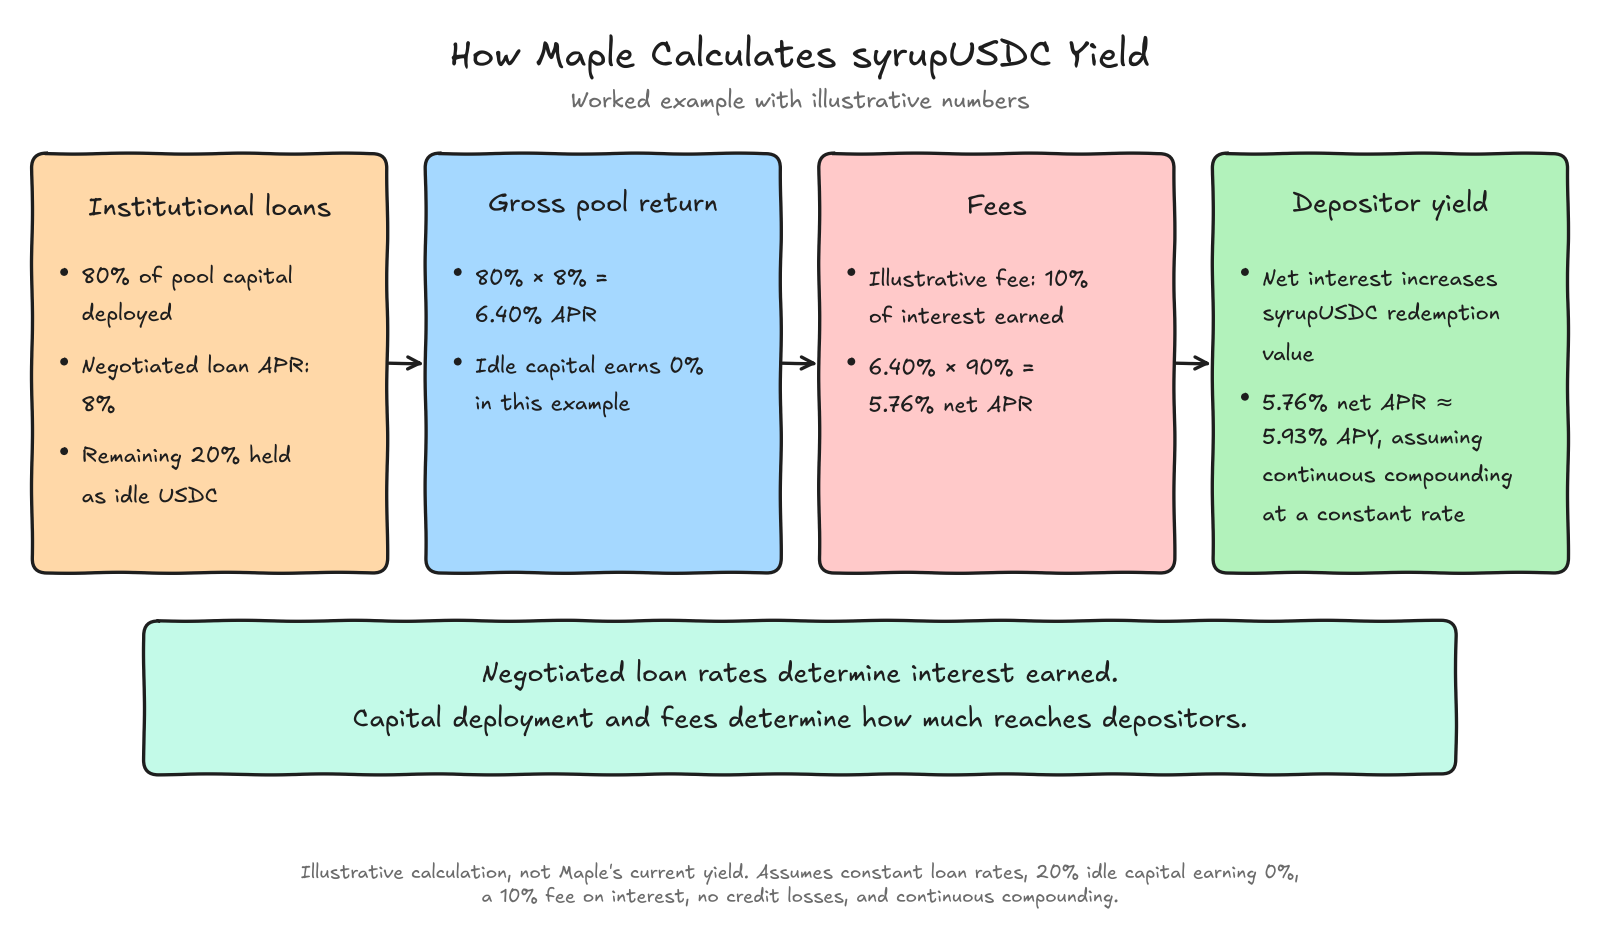
In the example, 80% of the pool earns 8% APR while the remaining 20% sits idle. That produces a 6.40% gross pool APR. After an illustrative 10% fee on interest, depositors earn a 5.76% net APR, equivalent to approximately 5.93% APY under continuous compounding.
Maple distributes accrued returns through syrupUSDC, whose redemption value increases as net interest accumulates.
Disclaimer: Actual yield changes with loan terms, capital deployment, fees, and credit performance.
The math explains how each rate is set, but other factors determine the yield depositors actually earn in the real world.
What Actually Changes USDC Yield in the Real World?
The USDC APY displayed on a platform is always a snapshot of current market conditions. It changes as borrowers take loans and depositors move capital.
The rate may fall, liquidity may tighten, or part of the advertised yield may come from temporary incentives.
How Deposits and Withdrawals Change APY
Consider a USDC lending pool with $100 million supplied and $80 million borrowed.
Event | Utilization | Likely effect on supply APR |
|---|---|---|
Starting position | 80% | Current rate |
$20M in new deposits | 66.7% | Decreases |
$10M withdrawn from the starting position | 88.9% | Increases |
$10M in additional borrowing from the starting position | 90% | Increases |
Each scenario starts from the original $100 million pool.
The same borrowing demand can produce different depositor returns depending on how much USDC is available. The impact also varies by platform:
Platform | What happens when deposits increase? |
|---|---|
Aave V3 | Utilization falls, generally reducing supply APR |
Compound V3 | Lower utilization moves the supply rate down its curve |
Morpho | Vault allocations can change the blended yield |
Spark | Deposits do not automatically change the governance-managed savings rate |
Maple | Undeployed capital can dilute the pool’s return |
This is why market conditions have such a big impact on the yield that finally shows up in depositors’ wallets.
The next big factor is liquidity depth.
Why High APY Can Coincide With Low Liquidity
A rising USDC lending APY can signal stronger borrowing demand. It can also signal that less USDC is available for withdrawals.
Consider a lending pool with $100 million supplied:
Pool utilization | USDC borrowed | USDC available | Withdrawal liquidity |
|---|---|---|---|
50% | $50M | $50M | High |
80% | $80M | $20M | Lower |
95% | $95M | $5M | Limited |
99% | $99M | $1M | Very limited |
Illustrative pool with no reserves or other liquidity adjustments.
Higher APYs can therefore come with a longer or less predictable exit. Available liquidity determines how quickly capital can be withdrawn.
Next, let’s compare advertised APY with the APY depositors actually earn.
How Rewards, Donations, and Points Inflate Headline APY
Some platforms advertise yields that include rewards or incentives alongside the interest generated by deposited USDC.
Platforms can combine several sources of return:
Yield component | How it works | What to watch |
|---|---|---|
Base lending yield | Interest paid by borrowers | Changes with utilization and loan rates |
Token rewards | Additional tokens distributed to depositors | Token prices and emission schedules |
Donations or incentives | One-off contributions that increase vault returns | May not recur |
Points | Rewards tied to future campaigns or distributions | No guaranteed monetary value |
For example, a vault earning 5% from lending and another 3% from token incentives may advertise an 8% combined annualized rate.
If the incentive program ends, the additional 3% disappears. This is why temporary incentives, points, and other rewards should always be evaluated separately.
We’ve covered how rates are calculated, what makes them change, and why headline APY can be misleading. Next, what practical steps can you take?
When Is a Higher APY Actually Worth Chasing?
A higher APY is worth considering only when the additional return compensates for the risks, costs, and restrictions involved.
A few fundamental questions, answered honestly, can help with this decision:
Where does the yield come from?
How stable is the rate?
How much is actually earned?
How quickly can USDC be withdrawn?
What capital is at risk?
The decision also depends on how long capital will remain deposited.
A small APY advantage can disappear after transaction costs, especially when funds move frequently between protocols.
The difficulty is keeping track of these changing rates and knowing when switching vaults is actually worthwhile. Automating that decision can reduce the need for constant monitoring and manual rebalancing.
How Quicknode Earn Optimizes Morpho Vault Yield
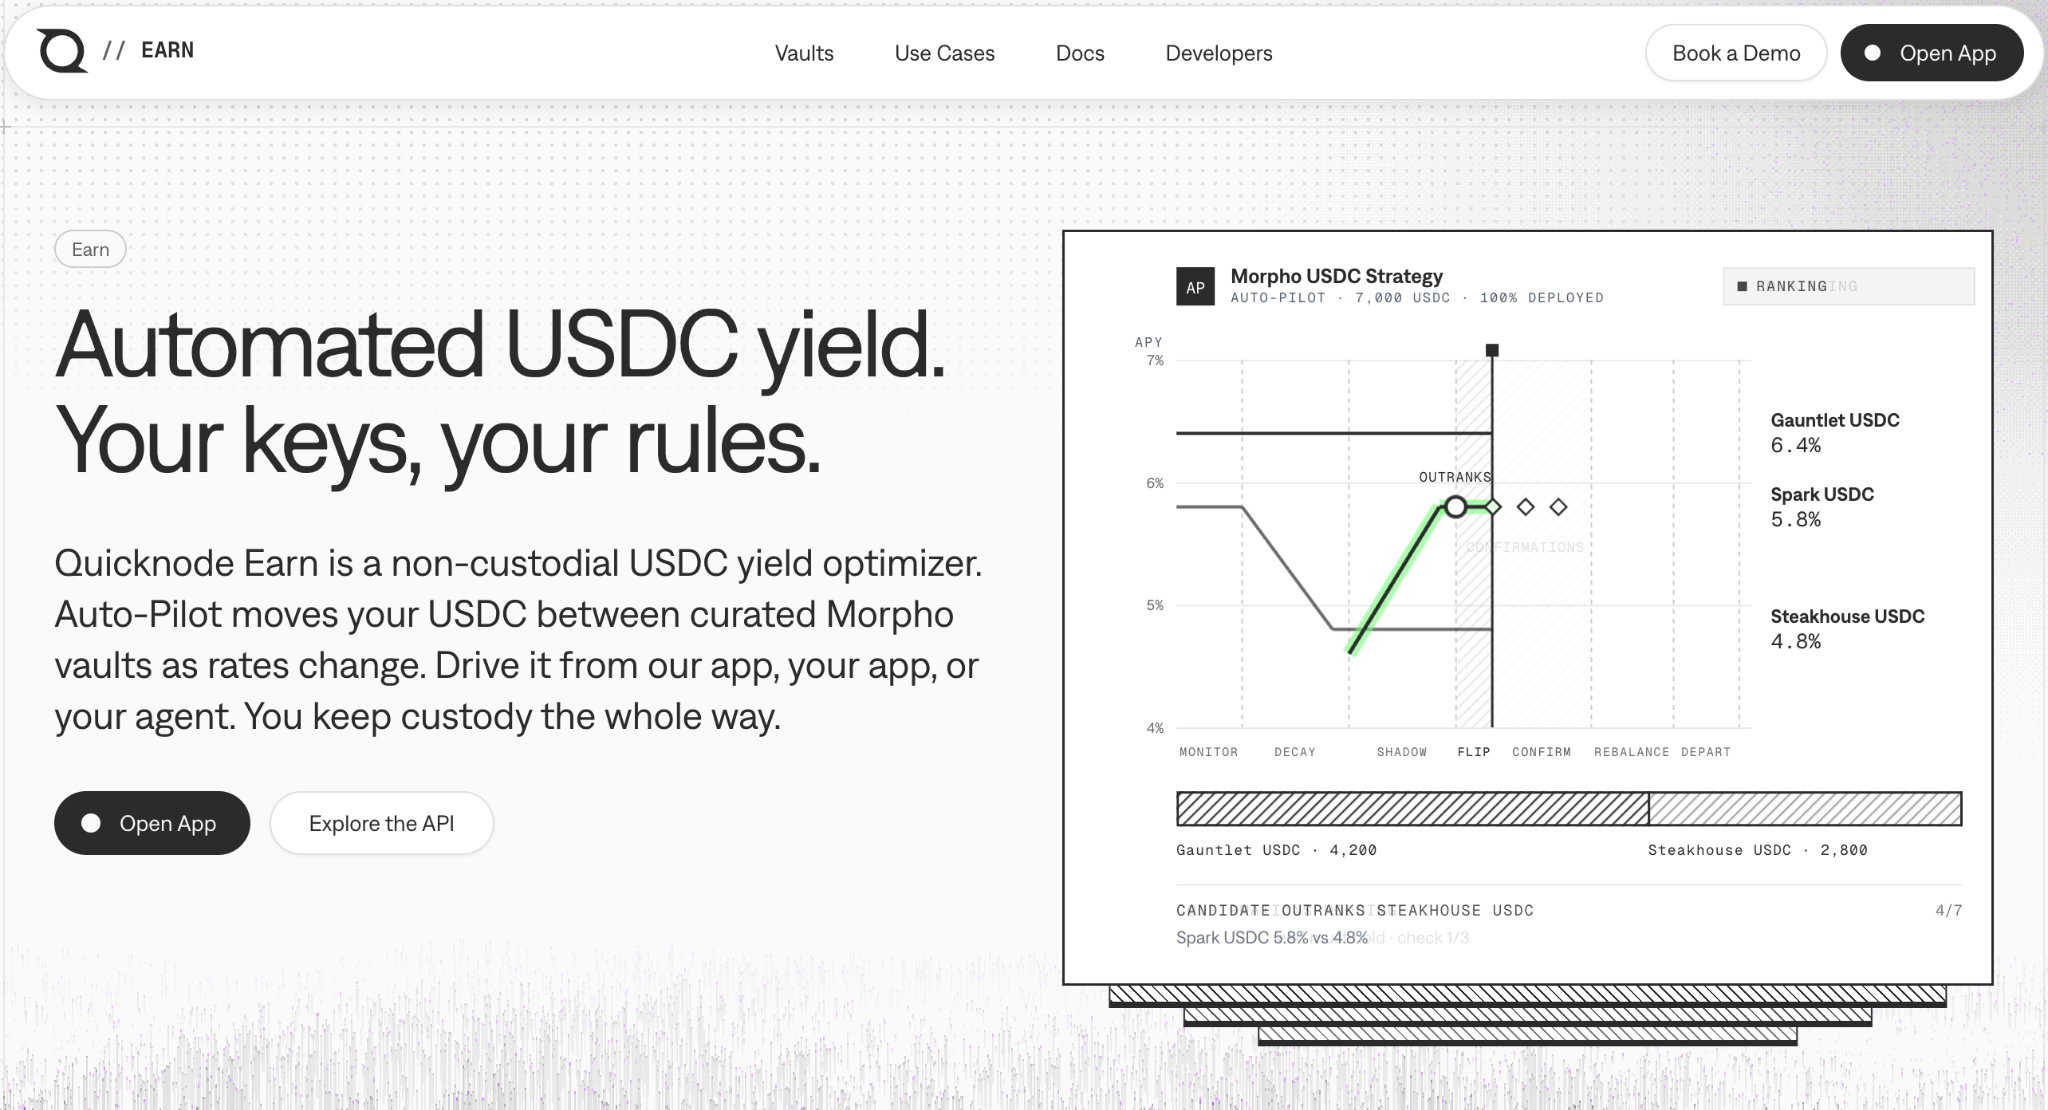
Quicknode Earn automates USDC allocation across eligible Morpho vaults. It monitors changing yields, compares opportunities, and rebalances capital when the market offers a better yield opportunity that also meets Earn’s predefined conditions.
The process follows four steps:
Step | How it works |
|---|---|
Set the rules | Select eligible networks, minimum vault size, liquidity requirements, and rebalancing thresholds. |
Monitor yields | Track vault APYs using five-minute snapshots and smoothed rates to reduce the impact of temporary spikes. |
Evaluate opportunities | Compare eligible vaults and check whether a higher yield persists long enough to justify switching. |
Rebalance capital | Move USDC when the yield advantage satisfies the configured thresholds and liquidity requirements. |
The important distinction is that a higher APY does not automatically trigger a rebalance. The improvement must be large enough to justify the move, accounting for transaction costs and the risk of short-lived rate changes.
Note: Quicknode Earn does not generate yield on its own. Morpho’s underlying lending markets generate the returns, while Earn manages allocation between eligible vaults.
There are no Quicknode management or performance fees. Rebalancing can incur gas costs, and realized returns still depend on vault performance, market liquidity, and the timing of capital movements.
Moving Forward: How to Act on USDC Yield
USDC yield starts with capital earning a return. Rates change. Capital moves.
A vault offering 9% today could earn less than one offering 7% over the next six months.
The duration of a yield advantage matters as much as its size.
Before moving USDC, establish where the additional yield comes from, how much remains after costs, and whether the capital can be withdrawn when needed.
If the advantage is temporary, driven by incentives, or too small to cover switching costs, stay put.
About Quicknode
Founded in 2017, Quicknode deploys institutional-grade blockchain infrastructure for developers and enterprises. With 99.99% uptime and support for 76+ chains, teams build and scale onchain applications without compromise.
Stay updated
The latest engineering insights, product updates, and web3 news delivered straight to your inbox.