Answers>Learn about monitoring & observability>Metrics vs logs vs traces
Metrics vs logs vs traces
// Tags
metrics logs tracesobservability pillars
TL;DR: Metrics, logs, and traces are the three fundamental data types of observability, each serving a distinct purpose in understanding system behavior. Metrics are aggregated numerical measurements tracked over time, ideal for dashboards, alerting, and trend analysis. Logs are timestamped records of individual events, best for debugging specific incidents and maintaining audit trails. Traces follow a single request's complete journey through a distributed system, revealing where time is spent and where bottlenecks occur. In practice, all three work together: a metric triggers an alert, logs provide the error details, and a trace shows the full context of the failing request path. Effective observability for blockchain applications requires all three pillars, because the distributed nature of blockchain infrastructure creates failure modes that no single data type can diagnose alone.
The Simple Explanation
Think of diagnosing a medical condition. Your vital signs (heart rate, blood pressure, temperature) are metrics: they tell you something is abnormal. Your medical records and test results are logs: they provide the specific details of what is happening. An MRI or CT scan is a trace: it shows the complete internal picture so the doctor can pinpoint exactly where the problem is.
In blockchain infrastructure, you face the same diagnostic challenge. Your application is distributed across your frontend, backend, RPC endpoints, blockchain nodes, and the chain itself. Each layer can fail or degrade independently. Metrics tell you something is wrong (latency spiked). Logs tell you what went wrong (a specific RPC method is returning errors). Traces tell you where in the request path the problem originated (the node took 3 seconds to process an eth_call against a complex contract).
What Is the Difference Between Monitoring and Observability?
Monitoring and observability are related but distinct. Monitoring watches known signals and tells you when a predefined threshold is crossed. Observability is the broader ability to ask new questions about your system using the data it emits, even for problems you did not anticipate. Metrics, logs, and traces are the raw materials of observability: together they let you move from "something is wrong" to "here is exactly why." For a deeper primer, see our overview of
Each pillar answers a different question and carries a different cost. The table below summarizes when to reach for each one.
Dimension
Metrics
Logs
Traces
Data type
Aggregated numbers
Timestamped events
Linked request spans
Best question
Is something wrong?
What went wrong?
Where did it go wrong?
Storage cost
Low
High
Medium, usually sampled
Best for
Dashboards and alerting
Root-cause debugging
Latency and bottleneck analysis
Example tools
Prometheus, Grafana
ELK, Loki, Splunk
OpenTelemetry, Jaeger
For blockchain systems, these pillars sit on top of broader infrastructure monitoring that watches node health, sync status, and RPC behavior.
Metrics in Detail
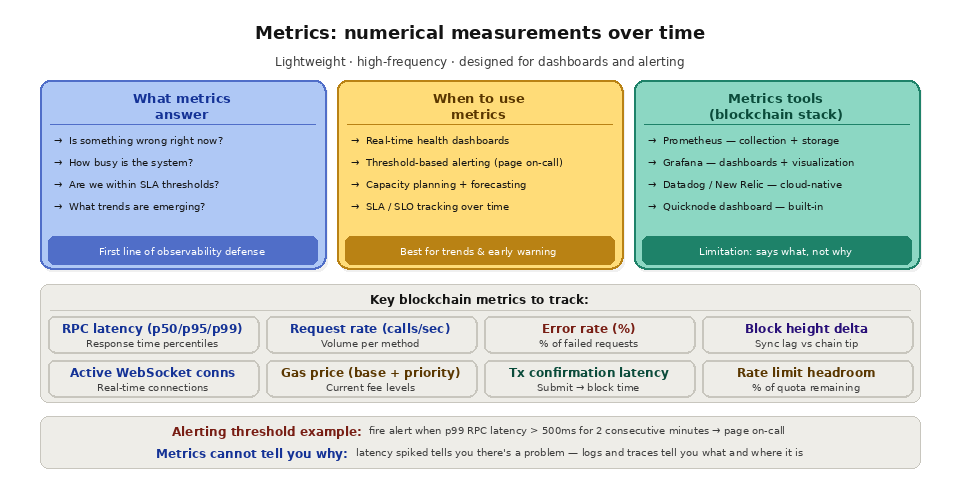
Metrics are numerical values collected at regular intervals and aggregated over time. They are lightweight, efficient to store, and designed for high-frequency collection. A typical blockchain application tracks metrics including RPC request rate (requests per second by method), response latency (p50, p95, p99 percentiles), error rate (percentage of requests returning non-200 status codes), block height delta (difference between your node's latest block and the chain tip), active WebSocket connections, gas price (current base fee and priority fee levels), and transaction confirmation latency.
Metrics are the first line of defense in observability. They power real-time dashboards that show at a glance whether your systems are healthy. They drive alerting rules that page your on-call engineer when something exceeds a threshold. And they enable capacity planning by showing long-term trends in resource usage and traffic patterns.
The standard metrics stack in the blockchain ecosystem typically involves Prometheus for collection and storage, Grafana for visualization and dashboarding, and Alertmanager or PagerDuty for alert routing. Cloud-native alternatives include Datadog, New Relic, and AWS CloudWatch. All of these tools are designed to handle the high-volume, time-series nature of metrics data.
The limitation of metrics is their aggregated nature. A metric tells you that p99 RPC latency crossed 500ms, but it does not tell you which specific requests were slow, what parameters they had, or what the node was doing when it was slow. For that level of detail, you need logs and traces.
Logs in Detail
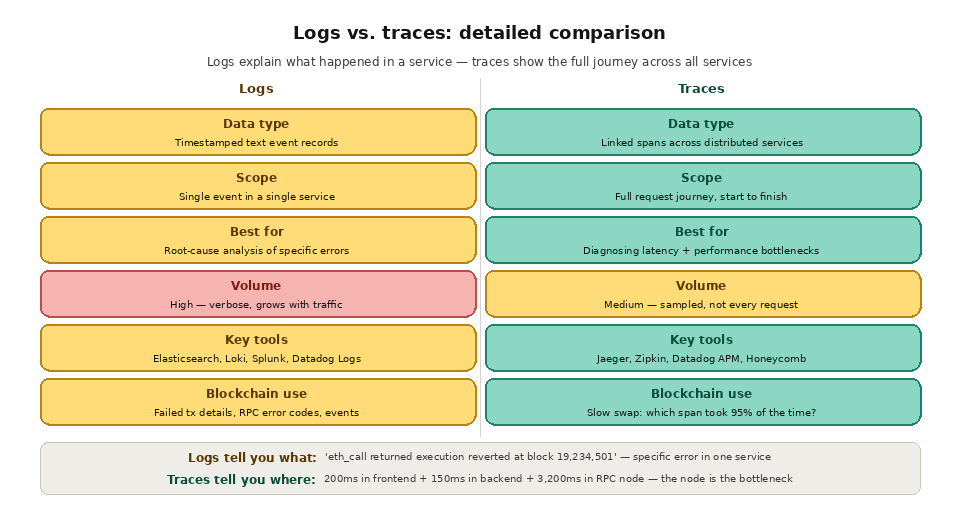
Logs are timestamped text records of individual events. Every time your application makes an RPC call, processes a transaction, encounters an error, or handles a user action, a log entry captures the details. Unlike metrics (which are numbers aggregated over intervals), logs are individual records with rich context: the full request parameters, the exact error message, the stack trace, the user ID, the transaction hash.
In blockchain applications, critical log categories include RPC request logs (method, parameters, response code, latency per request), transaction lifecycle logs (hash, status transitions from pending to confirmed to finalized), smart contract event logs (decoded events from your contracts with full parameter data), error logs (RPC errors, timeout exceptions, nonce conflicts, gas estimation failures), and application logs (user authentication events, business logic decisions, state changes).
Logs are the primary tool for root-cause analysis. When a metric alerts you that error rates have increased, you query your logs for recent error entries, filter by error type, and identify the pattern. Maybe a specific RPC method started returning "missing trie node" errors because the node pruned state data. Maybe transaction submissions are failing because of nonce conflicts from a concurrent processing bug. The logs contain the specifics that the metrics cannot.
Log management tools include Elasticsearch with Kibana (the "ELK stack"), Grafana Loki, Splunk, Datadog Logs, and AWS CloudWatch Logs. These tools store, index, and search log entries at scale, enabling full-text search, structured queries, and correlation across services.
The tradeoff with logs is storage volume and cost. Logging every RPC request for a high-traffic application generates gigabytes of data per day. Structured logging (where log entries are formatted as JSON with consistent field names) enables more efficient indexing and querying than unstructured text logs, and log sampling (recording only a fraction of routine events) can reduce volume without losing visibility into errors and anomalies.
Traces in Detail
Traces capture the end-to-end journey of a single request through a distributed system. A trace is composed of multiple spans, each representing a unit of work in a specific service. Spans are nested hierarchically (a parent span for the overall request, child spans for each sub-operation) and linked by a shared trace ID.
For a blockchain application, a single trace might capture the following spans: user clicks "swap" in the browser (frontend span, 50ms), frontend sends API request to backend (network span, 20ms), backend calls RPC endpoint for gas estimation (RPC span, 150ms), backend calls RPC endpoint for transaction submission (RPC span, 200ms), backend polls for transaction receipt (multiple RPC spans, 12,000ms total), backend sends confirmation to frontend (network span, 15ms), and frontend updates UI (frontend span, 30ms). The trace shows that 95% of the total time was spent waiting for on-chain confirmation, not in any of the application's own code.
Distributed tracing is implemented by injecting trace context (a trace ID and span ID) into every request as it flows through your system. Each service creates spans for its own work and propagates the trace context to downstream services. Tracing libraries like OpenTelemetry provide standardized instrumentation for most programming languages and frameworks. Visualization tools like Jaeger, Zipkin, and Datadog APM display traces as waterfall diagrams showing the timing and nesting of every span.
Traces are most valuable for diagnosing latency issues in distributed architectures. When a user reports that a transaction took 30 seconds to confirm, a trace shows you exactly where those 30 seconds were spent: 25 seconds waiting for block inclusion, 3 seconds in RPC calls, 1.5 seconds in backend processing, and 500ms in frontend rendering. You know immediately that optimizing your backend code will not help; the bottleneck is chain-level confirmation time.
Using All Three Together
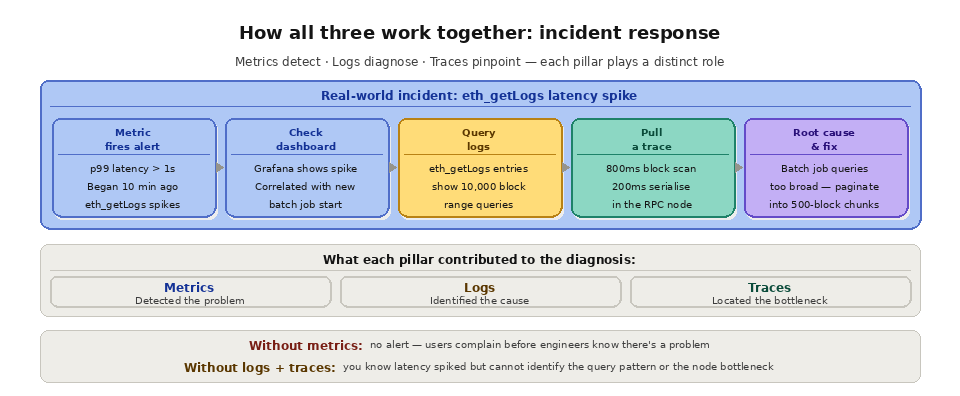
The three pillars are complementary, not competitive. A typical incident response workflow uses all three.
A metric alert fires: p99 RPC latency has exceeded 1 second. You open your Grafana dashboard and see that the latency spike began 10 minutes ago and is correlated with a spike in eth_getLogs calls. You query your logs for recent eth_getLogs requests and find that a new batch job started at the same time, making broad log queries spanning 10,000 blocks each. You pull a trace for one of these requests and see that the RPC node spent 800ms scanning blocks and 200ms serializing the response. The root cause is clear: the batch job's overly broad log queries are consuming disproportionate node resources. The fix is to paginate the queries into smaller block ranges.
Without metrics, you would not know there was a problem until users complained. Without logs, you would know latency increased but not which requests caused it. Without traces, you would know eth_getLogs was slow but not whether the bottleneck was in your application, the network, or the node's block scanning.
Which Pillar Should You Start With?
If you are bootstrapping observability, start with metrics, because they are cheap to collect and immediately surface problems through dashboards and alerting. Add structured logs next so you can investigate the issues your metrics reveal. Introduce distributed tracing once your system spans multiple services and you need to pinpoint where latency accumulates. For blockchain specifically, pairing this with RPC latency tracking covers the layer most likely to surprise you in production.
How Quicknode Supports All Three Pillars
Quicknode's dashboard provides built-in metrics for every endpoint: request volume, response latency, error rates, and method-level breakdowns. These metrics give developers immediate observability into their blockchain infrastructure layer without custom instrumentation.
For teams integrating blockchain metrics into their existing observability stack, Quicknode's Dedicated Clusters support Prometheus Exporter, enabling direct ingestion of node-level metrics into Prometheus, Grafana, Datadog, or any compatible system. This allows unified dashboarding across application metrics and blockchain infrastructure metrics.
Quicknode Streams provides observability for data pipeline health, including delivery metrics, processing status, and error reporting. Combined with RPC analytics and your own application-level logging and tracing, Quicknode gives developers the complete observability picture needed to diagnose and resolve issues across every layer of the blockchain stack.
Frequently Asked Questions
Are metrics, logs, and traces the same as monitoring?
No. They are the underlying data types. Monitoring is the practice of watching predefined signals and alerting on them, while observability uses these three data types to investigate problems you did not predict in advance.
Which of the three is most expensive to store?
Logs are usually the most expensive because they record every individual event with full detail. Metrics are the cheapest thanks to aggregation, and traces sit in between because they are typically sampled rather than captured for every request.
Do I need all three for a small application?
Not at first. Most teams start with metrics and basic logs. Distributed tracing becomes worthwhile once requests cross several services and latency is hard to attribute to a single component.
What is OpenTelemetry?
OpenTelemetry is an open standard and set of libraries for generating metrics, logs, and traces in a vendor-neutral way. It lets you instrument once and export to many backends like Prometheus, Jaeger, or Datadog.
How does this apply to blockchain RPC specifically?
RPC calls are a common source of latency and errors, so tracking request rate, latency percentiles, and error codes as metrics, capturing failing calls in logs, and tracing slow requests end to end gives you full visibility. Reliable node infrastructure, covered in our guide to node reliability, reduces the incidents you have to diagnose in the first place.