Answers>Learn about monitoring & observability>Monitoring blockchain infrastructure
Monitoring blockchain infrastructure
// Tags
blockchain monitoringnode monitoring
TL;DR: Monitoring blockchain infrastructure means continuously tracking the health, performance, and accuracy of the nodes, RPC endpoints, and data pipelines that your application depends on. Unlike monitoring a traditional web server, blockchain monitoring must account for chain-specific behavior like block production rates, sync status, finality checkpoints, mempool congestion, and gas price dynamics. The core metrics to track are block height (is your node current?), RPC latency (are requests fast?), error rates (are requests succeeding?), and data freshness (is your application seeing the latest state?). Effective monitoring combines automated alerting for immediate problems with dashboarding for trend analysis and capacity planning.
The Simple Explanation
If your application depends on a blockchain, your application is only as healthy as the infrastructure connecting it to that blockchain. A perfectly written smart contract and a beautifully designed frontend are worthless if the RPC endpoint serving your data goes down, falls behind, or starts returning errors. Monitoring is how you know when things break before your users do.
Traditional web application monitoring focuses on server CPU, memory, disk, and network. Blockchain infrastructure monitoring includes all of that plus a set of chain-specific metrics that do not exist in conventional systems. Is the node synced to the latest block? Is the node on the canonical chain or stuck on a fork? Are RPC responses returning data from the correct block height? Is the mempool congested enough to affect transaction confirmation times? These blockchain-specific signals are what separate a robust monitoring setup from one that misses critical failure modes.
What to Monitor
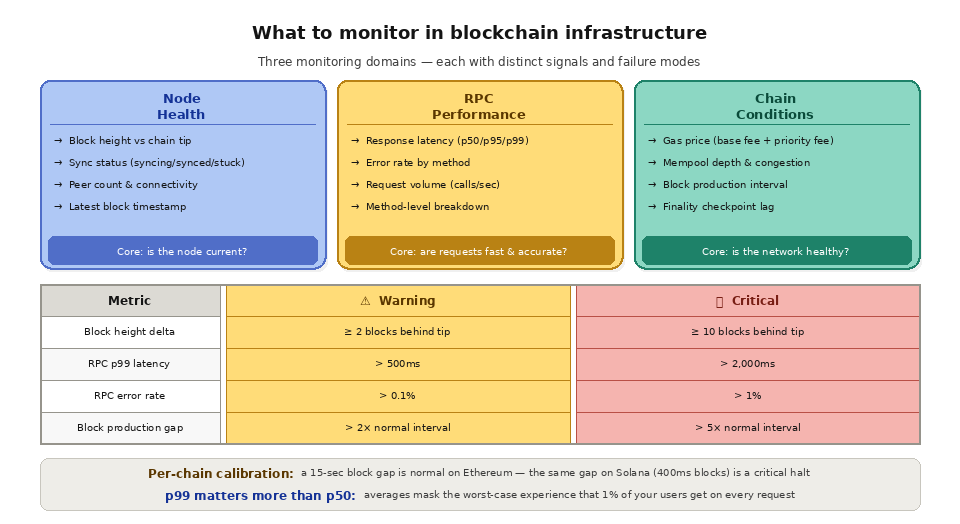
Node Health
The most fundamental metric is block height: what is the latest block your node has processed, and how does it compare to the chain's actual tip? A node that falls behind the tip (even by a few blocks) serves stale data. Your application might display outdated balances, miss recent transactions, or fail to detect confirmed events. On fast chains like Solana (400ms block times), even a small sync delay means your application is multiple blocks behind reality.
Monitor the delta between your node's block height and the chain tip. A healthy node should be within 0-1 blocks of the tip at all times. A delta of 2+ blocks is a warning signal. A delta of 10+ blocks means your node has a sync issue that needs immediate investigation.
Sync status indicates whether your node is actively syncing, fully synced, or stuck. A node that is "syncing" but making steady progress is healthy. A node that reports "syncing" but has not advanced its block height in minutes is stuck and needs attention.
Peer count tracks how many other nodes your node is connected to. A healthy node maintains connections to multiple peers for data propagation and consensus participation. A declining peer count can indicate network connectivity issues or configuration problems.
RPC Performance
Response latency is the time between sending an RPC request and receiving the response. Track this as percentiles (p50, p95, p99) rather than averages, because averages mask the worst-case performance that your users experience. A p50 latency of 50ms with a p99 of 2,000ms means most requests are fast, but 1 in 100 takes 2 full seconds. Those slow requests are what frustrate users.
Error rate is the percentage of RPC requests that return errors (non-200 HTTP status codes, JSON-RPC error responses, or timeouts). A healthy endpoint should have an error rate below 0.1%. Rates above 1% indicate a problem that needs immediate investigation. Common error types include 429 (rate limiting), 502/503 (node unavailable), and JSON-RPC errors like "missing trie node" (archive data not available) or "nonce too low" (transaction submission conflict).
Method-level breakdown separates metrics by RPC method (eth_call, eth_getBalance, eth_sendRawTransaction, etc.) because different methods have different performance profiles and failure modes. A spike in eth_getLogs latency might indicate a node struggling with log filtering, while a spike in eth_sendRawTransaction errors might indicate mempool congestion.
Chain Conditions
Gas price tracking is essential for any application that submits transactions. Monitoring the base fee and priority fee trends helps your application estimate appropriate gas prices, avoid overpaying during calm periods, and alert users when network congestion will make transactions expensive.
Mempool depth indicates how many pending transactions are waiting for inclusion. A growing mempool signals increasing congestion, which means higher fees and longer confirmation times. Applications that need predictable transaction confirmation should monitor mempool depth and adjust their behavior accordingly.
Block production rate varies by chain and can fluctuate during network issues. Monitoring block production intervals helps detect chain slowdowns or halts before they impact your application's functionality.
Setting Up Monitoring
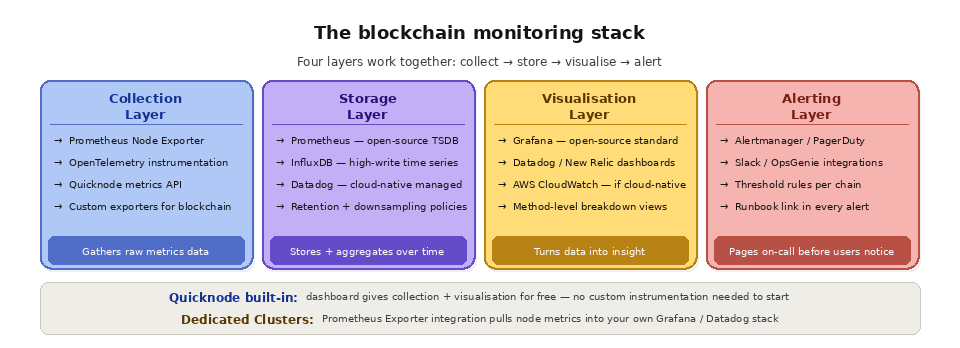
A standard blockchain infrastructure monitoring stack consists of a collection layer, a storage layer, a visualization layer, and an alerting layer.
The collection layer gathers metrics from your infrastructure. For self-hosted nodes, tools like Prometheus Node Exporter and custom metrics exporters collect system and blockchain-specific metrics. For managed endpoints, most providers offer API or webhook-based metrics access. Application-level metrics can be collected using OpenTelemetry, StatsD, or provider-specific SDKs.
The storage layer is a time-series database optimized for metrics data. Prometheus, InfluxDB, and Datadog are the most common choices. Time-series databases are designed for the high-write, time-ordered nature of metrics data, with built-in support for aggregation, downsampling, and retention policies.
The visualization layer turns raw metrics into actionable dashboards. Grafana is the industry standard for open-source monitoring visualization, with native support for Prometheus, InfluxDB, and dozens of other data sources. Datadog, New Relic, and AWS CloudWatch provide integrated visualization as part of their monitoring platforms.
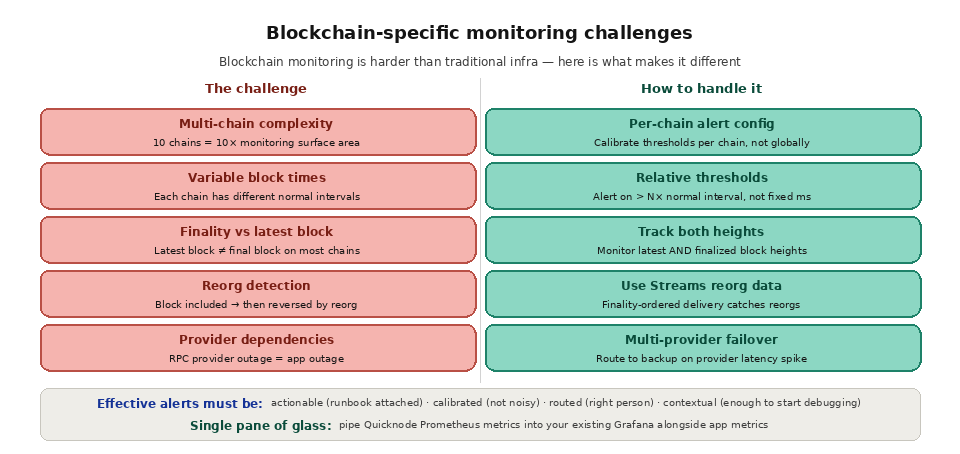
The alerting layer evaluates metrics against thresholds and notifies the right people when something needs attention. Effective alerts should be actionable (every alert should have a corresponding runbook), tuned (not so sensitive that they fire constantly, not so loose that they miss real problems), routed (sent to the on-call person via PagerDuty, Slack, or similar), and contextual (including enough information to start diagnosing the issue without needing to open a dashboard).
Blockchain-Specific Monitoring Challenges
Multi-chain environments multiply the monitoring complexity. If your application supports 10 chains, you need to track node health, RPC performance, and chain conditions for each one. Each chain has different block times, different finality models, and different failure modes. A monitoring setup that works perfectly for Ethereum may miss critical signals on Solana, and vice versa.
Variable block times make it harder to set static alerting thresholds. A 15-second gap between Ethereum blocks is normal. A 15-second gap on Solana (where blocks should come every 400ms) is a serious issue. Alerts need to be calibrated per chain, not set universally.
Finality awareness is important for monitoring data pipelines. Monitoring should track not just the latest block your node has seen, but the latest finalized block. Data from blocks that have not yet reached finality may be reversed by a reorg, so applications that rely on finalized data need monitoring that distinguishes between the latest and the finalized block heights.
What are the most important blockchain monitoring metrics to track?
A few high-signal metrics catch the majority of blockchain infrastructure problems. The table below summarizes what each one tells you, the range that indicates a healthy setup, and the point at which you should page an on-call engineer.
Metric
What it measures
Healthy range
When to alert
Block height delta
Distance from the chain tip
Within 0 to 1 block
10 or more blocks behind
RPC latency (p99)
Slowest 1% of responses
Under 500 ms
Above 2 seconds
Error rate
Share of failed requests
Below 0.1%
Above 1%
Peer count
Connected network peers
Stable, above the client minimum
Sudden or sustained drop
Mempool depth
Pending transactions waiting
Steady for the chain
Rapid, sustained growth
Data freshness
Age of the latest served state
Seconds old
Minutes behind the tip
Track these as time series rather than single readings so you can spot trends before they become outages. Latency in particular should be measured as percentiles: read more on what drives RPC latency and how it fits into broader blockchain observability.
How is blockchain monitoring different from traditional infrastructure monitoring?
Standard server monitoring tells you whether a machine is up, but a blockchain node can pass every infrastructure check while quietly serving stale or reorged data. Blockchain monitoring layers chain-aware signals on top of the usual host metrics.
Aspect
Traditional infrastructure monitoring
Blockchain infrastructure monitoring
Primary health signal
CPU, memory, disk, network
Block height, sync status, finality
Common failure mode
Server down or overloaded
Node online but serving stale or reorged data
Correctness risk
Low once the server responds
Valid data can be reversed by a reorg
Latency baseline
Fixed per service
Varies per chain and per RPC method
Scope
One stack
One setup per chain across many chains
The biggest difference is correctness over time. A response can be accurate when returned and then invalidated seconds later, which is why monitoring should distinguish the latest block from the finalized block. See blockchain finality for why that distinction matters for data pipelines.
Can you monitor blockchain infrastructure without running your own node?
Yes. Managed RPC providers expose dashboards and metrics for request volume, latency, and error rates without any instrumentation on your side, which removes most of the operational burden of self-hosted monitoring. This is often the fastest path to high availability, since the provider handles node health, scaling, and redundancy for you. Quicknode's Core API ships with per-endpoint analytics out of the box, so you get visibility into your infrastructure from the first request.
How do you monitor multi-chain blockchain infrastructure?
Multi-chain monitoring means calibrating thresholds per chain, because a delay that is normal on Ethereum can be a serious incident on a sub-second chain. Centralize metrics from every chain into one dashboard and alert on per-chain baselines. For data pipelines, Quicknode Streams reports delivery success and processing latency per chain, so you know the moment one network falls behind.
Frequently Asked Questions
How often should you monitor blockchain infrastructure?
Continuously. Collect block height and latency every few seconds and evaluate alert rules in near real time. Fast chains produce multiple blocks per second, so a one minute polling interval can hide a node that has already fallen far behind. Pair short collection intervals with the three pillars of metrics, logs, and traces for full coverage.
What is a good RPC error rate?
A healthy endpoint stays below 0.1% errors. Anything above 1% signals a real problem such as rate limiting, an unavailable node, or missing archive data. Always break errors down by method so you can see which calls are failing and why.
What is the difference between latest and finalized block monitoring?
The latest block is the newest one your node has seen, while the finalized block has reached a point where it will not be reversed. Applications that depend on settled data should alert on finalized height, since data from unfinalized blocks can disappear in a reorg.
How do you monitor for blockchain node downtime?
Track block height delta, peer count, and error rate together, then route alerts to an on-call channel. Combining monitoring with strong node reliability practices and automatic failover keeps traffic flowing to a healthy node the moment one degrades.
What tools are used to monitor blockchain infrastructure?
The common open-source stack is Prometheus for collection and storage, Grafana for dashboards, and Alertmanager for routing. Managed providers add built-in analytics, and Dedicated Clusters can export node-level metrics straight into an existing Prometheus or Datadog setup.
How Quicknode Provides Monitoring
Quicknode includes built-in monitoring and analytics for every endpoint. The Quicknode dashboard displays real-time and historical metrics including request volume, response latency, error rates, and method-level breakdowns. These metrics are available without any custom instrumentation, giving developers immediate visibility into their blockchain infrastructure health.
For teams with existing monitoring infrastructure, Quicknode's Dedicated Clusters support Prometheus Exporter integration. This lets you pull node-level and endpoint-level metrics directly into your Prometheus instance, Grafana dashboards, or Datadog, enabling unified monitoring across your application stack and your blockchain infrastructure in a single platform. Dedicated Clusters also include 14-day log retention for detailed request-level analysis.
Quicknode Streams provides monitoring for data pipeline health, including delivery success rates, processing latency, and error logs. For teams running multi-chain data pipelines, Streams monitoring ensures you know when a pipeline falls behind or encounters delivery issues, before missing data impacts your application.