Answers>Learn about monitoring & observability>What is observability?
What is observability?
// Tags
observabilitymonitoring observability
TL;DR: Observability is the ability to understand what is happening inside a system by examining its external outputs. In blockchain infrastructure, observability means having the metrics, logs, and traces needed to answer questions like "why is my dapp slow?", "why did this transaction fail?", and "is my RPC endpoint healthy?" It goes beyond simple monitoring (which tells you something is wrong) by giving you the data to understand why it is wrong. Observability rests on three pillars: metrics (numerical measurements over time), logs (timestamped event records), and traces (end-to-end request journeys through distributed systems).
The Simple Explanation
Monitoring tells you your car's engine light is on. Observability tells you the engine light is on because the O2 sensor in cylinder 3 is reading lean at 2,500 RPM, which started after last week's fuel filter replacement, and the pattern matches a known issue with aftermarket filters.
In software engineering, observability is the practice of instrumenting your systems so thoroughly that you can diagnose any problem without having to reproduce it or add new instrumentation after the fact. You do not need to anticipate every possible failure mode in advance. You need enough raw data (metrics, logs, traces) that when something unexpected happens, you can trace backward from the symptom to the root cause.
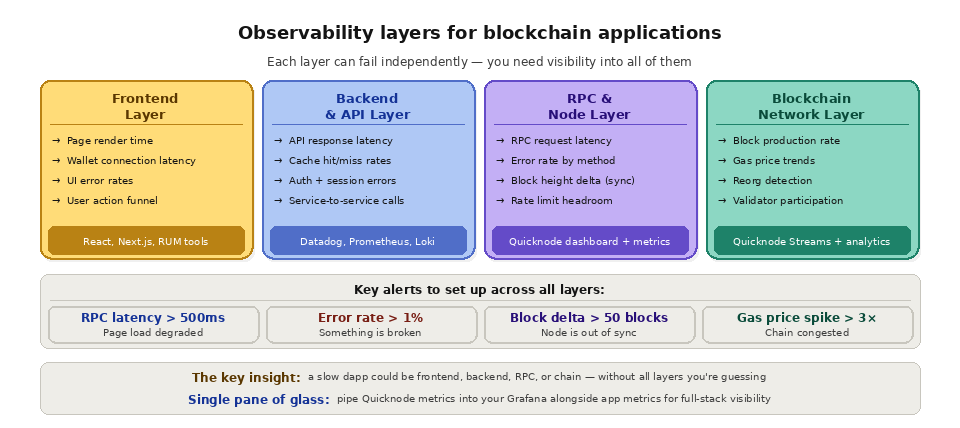
For blockchain applications, observability is especially critical because the systems are distributed across multiple layers: your frontend, your backend, your RPC provider, the blockchain node, the consensus network, and the chain itself. A user experiencing a slow balance update could be caused by a slow frontend render, a backend caching issue, RPC endpoint latency, node sync lag, or chain congestion. Without observability across every layer, diagnosing the actual cause requires guesswork.
The Three Pillars of Observability
Metrics
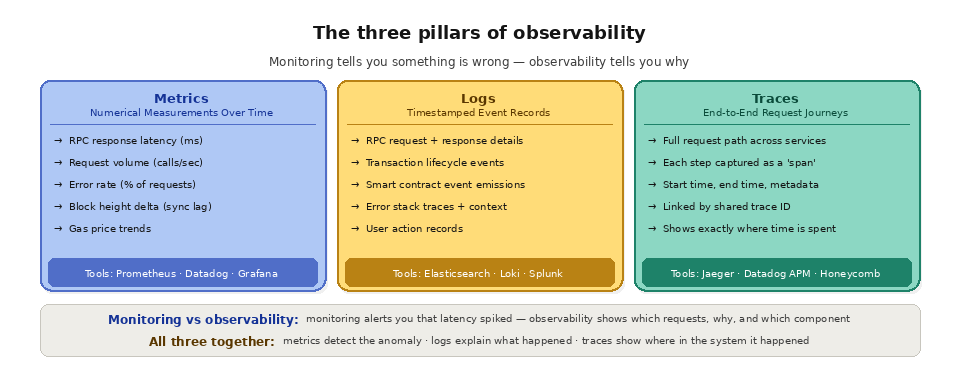
Metrics are numerical measurements collected at regular intervals over time. They are the foundation of dashboards and alerting. In blockchain infrastructure, key metrics include RPC response latency (how long each API call takes), request volume (how many calls per second your application is making), error rate (what percentage of requests return errors), block height delta (how far behind your node is from the chain tip), gas price trends (current network fee levels), and transaction confirmation time (how long from submission to block inclusion).
Metrics are best suited for understanding trends and detecting anomalies. A sudden spike in RPC latency, a gradual increase in error rate, or a drop in request throughput are all signals that something has changed. Metrics tools like Prometheus, Datadog, and Grafana collect, store, and visualize metrics over time, enabling both real-time dashboards and historical trend analysis.
The strength of metrics is that they are lightweight and aggregated, so they can be collected at high frequency without generating enormous data volumes. The limitation is that metrics tell you what is happening but not why. You know latency increased, but you do not know which specific requests were slow or what caused them to be slow.
Logs
Logs are timestamped records of discrete events. Every significant action your system takes, every error it encounters, every decision it makes, can be recorded as a log entry. In blockchain applications, relevant logs include RPC request and response details (method, parameters, response time, status), transaction lifecycle events (submitted, pending, confirmed, failed), smart contract event emissions (decoded event data from your contracts), error details (stack traces, error codes, request context), and user actions (wallet connections, transaction approvals, page navigations).
Logs excel at providing the detail needed to diagnose specific incidents. When a metric alerts you that error rates have spiked, logs tell you which specific errors are occurring, which endpoints are affected, and what the request parameters were. Log analysis tools like Elasticsearch, Loki, Splunk, and CloudWatch Logs enable searching, filtering, and correlating log entries across services and time ranges.
The tradeoff with logs is volume. Detailed logging of every RPC call, every transaction event, and every user action generates enormous amounts of data. Log storage costs can grow quickly, and searching through millions of log entries for a specific event requires efficient indexing and query tools.
Traces
Traces follow a single request's journey through a distributed system from start to finish. When a user initiates a token swap, the trace captures every step: the frontend processing time, the backend API call latency, the RPC request to the node, the node's processing time, the transaction submission, and the eventual block confirmation. Each step is recorded as a "span" with a start time, end time, and metadata. Spans are linked together by a trace ID, forming a complete picture of the request's path.
Traces are essential for diagnosing performance issues in distrib
uted architectures. If a swap transaction takes 8 seconds from user click to confirmation display, a trace shows you that 200ms was frontend rendering, 100ms was backend processing, 500ms was RPC latency, 12 seconds was on-chain confirmation (which your application waited for), and the remaining time was websocket event delivery. You now know exactly where the time was spent and which component to optimize.
Distributed tracing tools like Jaeger, Zipkin, Datadog APM, and Honeycomb are designed to collect, store, and visualize traces across services. They are particularly valuable for microservice architectures where a single user request touches multiple services, databases, and external APIs.
Why Observability Matters for Blockchain Applications
Blockchain applications are inherently distributed across multiple independent systems: your infrastructure, your RPC provider's infrastructure, and the blockchain network itself. This creates a wider surface area for failures and performance degradation than a traditional application that only depends on its own servers and database.
RPC endpoint issues are among the most common problems blockchain developers face. An endpoint might be returning stale data (because the underlying node is behind on sync), responding slowly (because of geographic distance or load), or returning errors (because of rate limiting or node failures). Without observability into your RPC layer, these issues are invisible until users complain.
Onchain conditions affect your application even though they are outside your control. Chain congestion increases gas prices and confirmation times. Block reorganizations can invalidate recently confirmed transactions. Validator downtime on smaller chains can cause block production delays. Observability tools that track chain-level metrics alongside your application metrics give you the full picture of what is affecting your users.
What is the difference between observability and monitoring?
Monitoring and observability are related but not interchangeable. Monitoring watches a known set of signals and tells you when one of them crosses a threshold: it answers "is something wrong?" Observability is the broader capability to ask open-ended questions about your system using rich data, so you can answer "why is it wrong?" even for failures you never anticipated. Monitoring is a subset of observability; you need monitoring to catch problems and observability to explain them.
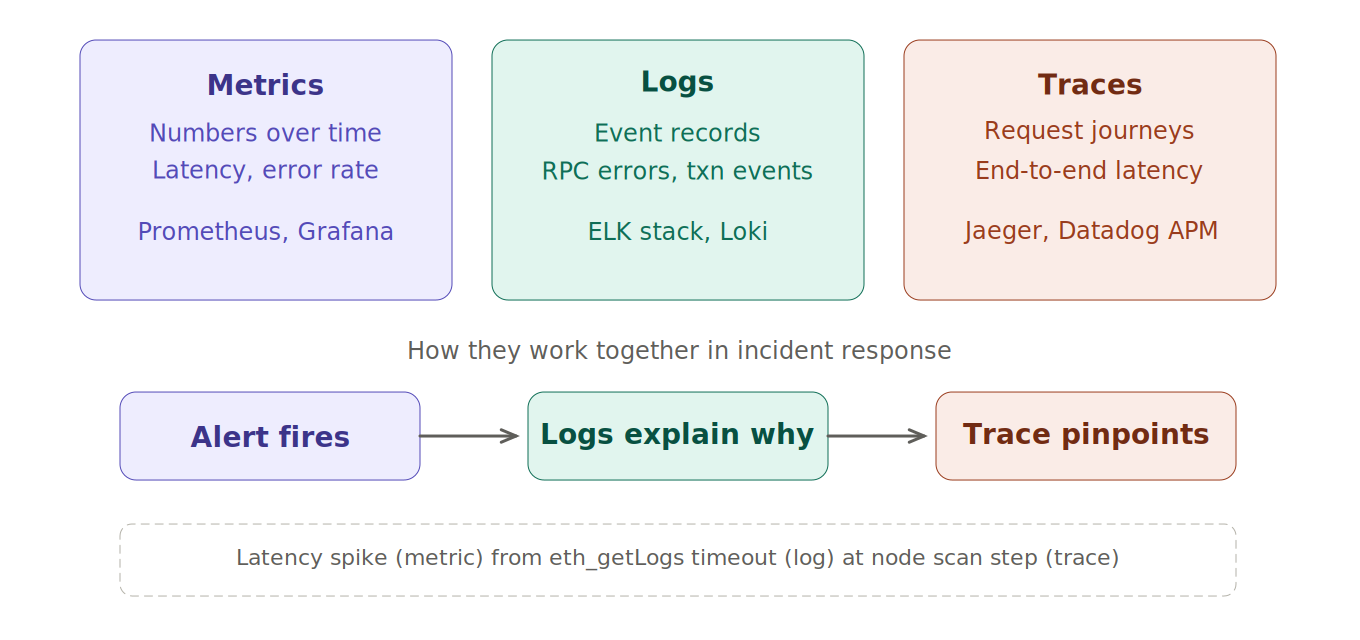
The three pillars are complementary, not competing. Metrics tell you something changed, logs tell you what specifically happened, and traces tell you where in a distributed request the time or error occurred. A healthy observability practice uses all three: an alert fires on a metric, a trace narrows the problem to one service, and logs reveal the exact error. The table below maps each pillar to the question it answers best.
Pillar
Answers
Blockchain example
Common tools
Metrics
What changed and when?
RPC latency spiked at 14:02
Prometheus, Grafana
Logs
What exactly happened?
eth_call returned a timeout error
Loki, Splunk
Traces
Where was the time spent?
500 ms in the RPC span
Jaeger, Datadog APM
For a deeper comparison of the pillars, see metrics vs logs vs traces. Tracking RPC latency as a first-class metric is one of the highest-value signals for a blockchain app.
How do you make blockchain infrastructure observable?
Start by instrumenting the RPC layer, since it sits between your app and the chain: record request volume, latency percentiles, and error rates per method. Add health checks that compare your node's block height to the chain tip so you catch sync lag early. Then wire alerts to the signals that actually predict user pain, and design for resilience so a single failure does not blind you. Pair observability with reliable nodes, high availability, and a tested failover path so that when something breaks, you can both see it and route around it.
Frequently Asked Questions
Is observability the same as monitoring?
No. Monitoring watches predefined signals and alerts you when something crosses a threshold, while observability gives you enough data to investigate any problem, including failures you did not anticipate. Monitoring is one part of a broader observability practice.
What are the three pillars of observability?
Metrics, logs, and traces. Metrics are numerical measurements over time, logs are timestamped records of discrete events, and traces follow a single request through a distributed system. Together they let you detect, explain, and locate problems.
Why is observability harder for blockchain apps?
Blockchain applications span your own infrastructure, a third-party RPC provider, and the chain itself, so failures can originate in layers you do not control. That wider surface area means you need visibility across every layer, including chain-level conditions like congestion and reorgs.
Which metrics matter most for RPC infrastructure?
Response latency, request volume, error rate, and block height delta are the core signals. Latency and errors reveal endpoint health, request volume shows load, and block height delta tells you whether the node is keeping up with the chain tip.
Do I need separate tools for each pillar?
Not necessarily. Many platforms cover more than one pillar, and providers often expose RPC analytics and metrics exporters you can pull into an existing stack. The goal is unified visibility across application and blockchain layers rather than a specific number of tools.
How Quicknode Supports Observability
Quicknode provides built-in observability features for the blockchain infrastructure layer. The Quicknode dashboard includes real-time analytics showing request volume, response latency, error rates, and method-level breakdowns for every endpoint. This gives developers immediate visibility into their RPC usage patterns without needing to instrument their own monitoring.
For teams with existing observability stacks, Quicknode's Dedicated Clusters support Prometheus Exporter integration, allowing you to pull node-level metrics directly into your Grafana dashboards, Datadog, or any Prometheus-compatible monitoring system. This enables unified observability across your application infrastructure and your blockchain infrastructure in a single pane of glass.
Quicknode Streams adds observability for your data pipeline layer, providing delivery status, processing metrics, and error reporting for every Stream. Combined with the RPC analytics dashboard, this gives developers comprehensive visibility into both their real-time API access and their streaming data ingestion.