Web3 Revenue Models Deep Dive: How Dapps Generate $10B+ Onchain Annually
Web3 Revenue Models Deep Dive: How Dapps Generate $10B+ Onchain Annually
A breakdown of onchain revenue in 2025. This deep dive breaks down revenue models, top-earning dapps, and winning formulas in web3.

July 7, 2025 — 13 min read
Cryptocurrencies and by extension, web3 are making a generational leap.
A leap away from legacy institutions built around gatekeepers, intermediaries, and closed systems. A leap toward open networks, programmable money, and user-owned platforms. Like any leap of this scale, a few are bound to fall and land badly.
The industry is learning this lesson in real time.
Just a year or two back, the conversations were around tokens, FDVs (fully-diluted valuations), testnets, and airdrops. The consequences of these were blockchains and protocols becoming ghost towns right after the airdrop, developers and users jumping to the next shiny thing and similar knee-jerk reactions all over the place.
Today, the situation is slightly better and more long-term conversations are taking place.
The new question driving founders, investors, and users isn’t “what’s the token price?” but “how does your dapp/protocol/blockchain/platform make money?”.
This report is your answer to that fundamental question.
We break down how top dapps are making money onchain, the different types of revenue models there are, and predict the future of onchain revenue.
How Onchain Revenue Works: The ABCs
When Compound shows $2.6 billion in TVL but generates ~$45 million in actual revenue annually, what does it mean?
The answer reveals everything about how web3 business models actually work.
Metrics like TVL (total value locked) and token price have long dominated attention but neither tells you if a protocol is actually earning anything.
The metric that matters most is revenue.
Revenue is effectively what the dapp retains after paying all the expenses, distributing incentives to depositors, stakers, or LPs, etc.
Fees earned are what users pay to use the protocol. Think trading fees on Uniswap or storage fees on Filecoin.
Token price reflects market sentiment and speculation. More often than not, this is disconnected from actual protocol performance.
TVL shows capital parked in a protocol. It reflects trust and adoption, but not necessarily business viability since TVLs can exit instantly during market stress.
At its core, onchain revenue is the value captured by a protocol, dapp, or platform in return for providing a service or infrastructure.
That value is usually collected in the form of:
Fees (trading, minting, bridging, staking, etc.)
Spreads (lending, stablecoin yield, MEV capture)
Subscriptions or paid usage (infra, storage, APIs)
Now, in the next section, let’s dive deeper into each of these revenue drivers, see examples of projects, and decode what’s actually working in web3 today.
The 3 Core Revenue Models of Dapps
Every onchain business, whether it’s a DeFi protocol, NFT platform, L2, or social app, ultimately earns revenue in one of three ways:
Volume-based revenue (from financial flows)
Usage-based revenue (from individual user actions)
Infrastructure monetization (from developers and apps building on them)
Volume-Based Protocols
Volume-based protocols take a cut of every transaction that flows through their system. The math is simple: more activity equals more revenue.
Protocol | Revenue Driver | Mechanics | Annual Fees Earned (in $M) | Annual Revenue (in $M) |
|---|---|---|---|---|
Trading fees | 0.3% fee on every swap, split between LPs and protocol treasury | 947.7 | Nil* | |
*Despite generating the most fees, Uniswap hasn't activated its fee switch, so all revenue currently goes to LPs.
Source: Token Terminal
Volume-based models create powerful network effects. More liquidity attracts more traders, which generates more fees, which attracts more liquidity providers.
The flywheel accelerates, but it also means these protocols live and die by market activity.
Usage-Based Dapps
Usage-based protocols charge for specific actions or premium features. Unlike volume-based models, revenue comes from user engagement rather than asset movement — minting an NFT, posting a message, unlocking a feature, or buying an upgrade.
Protocol | Revenue Driver | Mechanics | Annual Fees Earned (in $M) | Annual Revenue (in $M) |
|---|---|---|---|---|
Minting fees | Taking a 2.5% cut on every mint. | 107.8 | 62 | |
Source: Token Terminal
Usage-based models require deeper user engagement but offer more predictable revenue streams. They succeed when the platform becomes essential to users' workflows or income generation.
Infrastructure Services
Infrastructure protocols earn money by providing essential backend services, often in the form of gas fees, APIs, compute, storage, or security, that developers and users can't easily build themselves.
Protocol | Revenue Driver | Mechanics | Annual Fees Earned (in $M) | Annual Revenue (in $M) |
|---|---|---|---|---|
L2 gas fees + MEV | Users pay gas to use apps onchain; part of it is retained by Arbitrum | 19.5 | 19.5 | |
Source: Token Terminal
These services are the backbone of web3. When devs build on them, revenue becomes recurring and defensible.
Unique Revenue Drivers
Beyond these core models, several unique mechanisms are generating significant revenue:
Staking rewards create value for validators and delegators while securing networks. Ethereum staking alone generates over $2 billion annually.
Management fees from yield-bearing stablecoins like Ethena and Pendle provide consistent revenue streams.
MEV capture through block building and transaction ordering is a major revenue source for some validators.
L2 sequencer fees represent a new category entirely, where rollups earn money by processing transactions more efficiently than mainnet Ethereum.
Royalties + protocol-level take rates for projects in the creator economy space, giving the platform and users a piece of the revenue.
As usual, the most successful protocols often combine multiple revenue streams.
Uniswap generates trading fees and governance revenue.
Aave earns lending spreads and charges liquidation fees.
This diversification provides stability and multiple paths to growth. Now, let’s crunch some more numbers to put dapps, their revenue, and the market in perspective.
The Dapp Revenue Map of 2025
Over the past year, web3 has generated billions in onchain revenue. Let’s first see the breakdown of revenue of the entire space before we dive deeper into sectors.
Web3 Revenue: Last 365 Days
(as of July 2025)
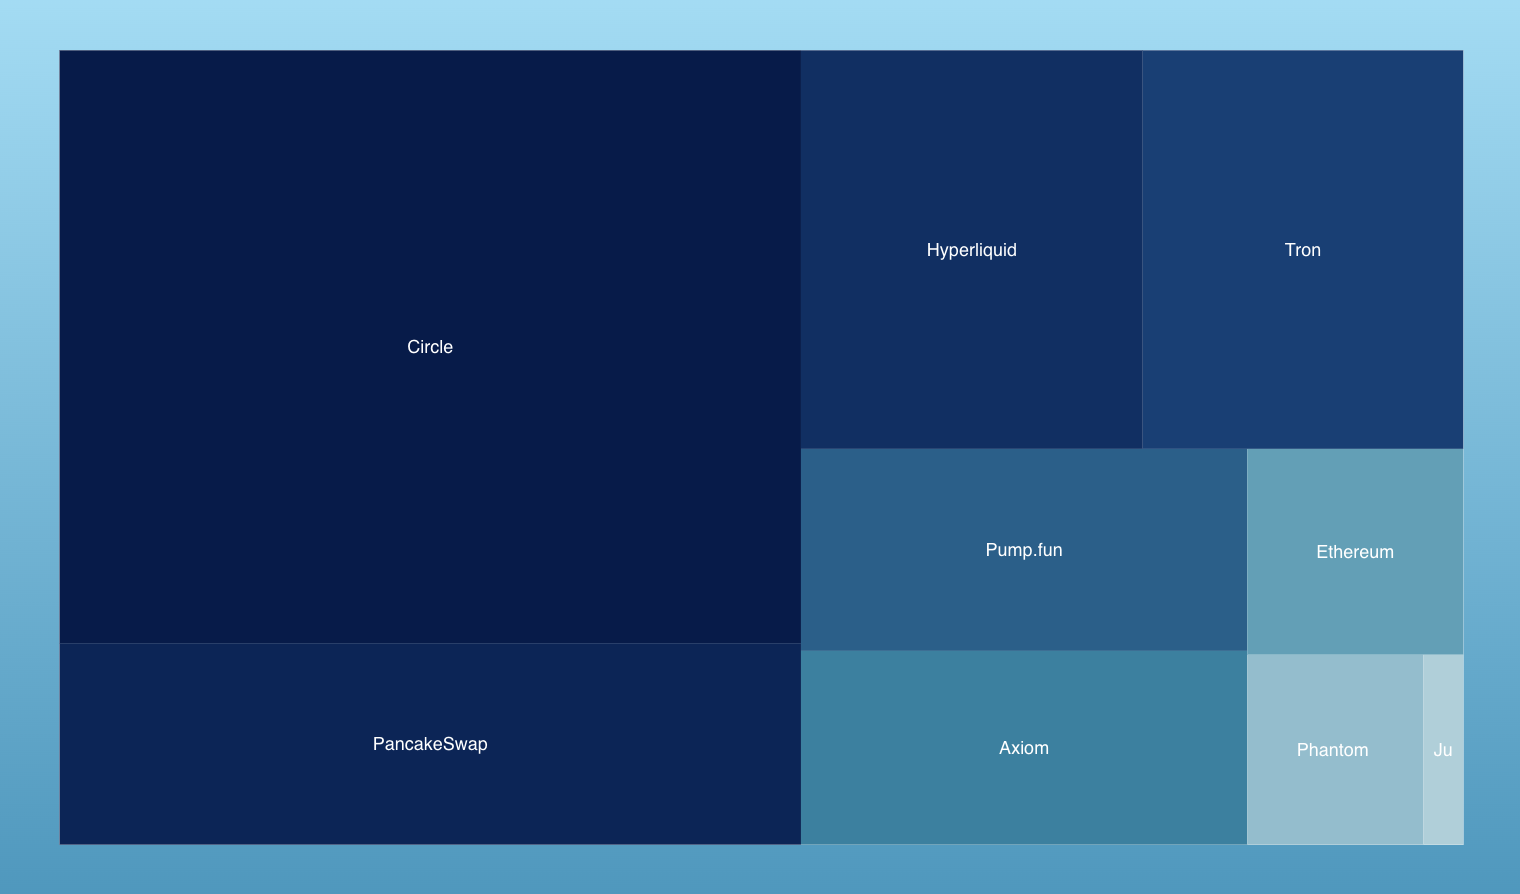
Source: DeFi Llama (All revenue estimates are annualized as of July 2025.)
Looking at this revenue treemap for the last 30 days, we can see that in the last 30 days alone, web3 has generated over $1 billion in revenue.
Here are the key takeaways:
Stablecoin issuers remain the most profitable businesses in crypto, with yield-on-reserves dwarfing every other revenue model.
Perpetual DEXs like Hyperliquid and gamified DEXs like pump.fun are thriving, pointing to user demand for high-risk, high-speed financial products.
Infra protocols are climbing the ranks and will likely dominate the next cycle of B2D monetization.
Ethereum and Tron both prove that base layers can sustain protocol-level revenue, even as L2s and alt L1s grow.
Surprise, surprise: Revenue concentration is extreme but different than expected.
Instead of a few DeFi protocols dominating, it is foundational infrastructure like stablecoins and blockchains that is capturing most value.
Next, let’s dive deeper into different sectors in web3 and who the top revenue earners are.
First, let’s see which dapps make the most money in web3. This means, no blockchains, no stablecoin issuers, or similar infra or non-dapp participants.
Top 5 Dapps by Revenue
Dapps are the interfaces people actually use and for us, that represent the ground reality of economic activity onchain.
Rank | Protocol | Category | 30-Day Revenue | Primary Revenue Mechanism |
|---|---|---|---|---|
1 | DEX | $65.17M | Trading fees (~0.25% per swap) | |
Source: DeFi Llama
Key takeaway: Trading dominates dapp revenue.
4 of the top 5 revenue-generating dapps are trading-related. Paying fees for liquidity and trading infra are the primary value capture mechanisms in web3.
Top 5 DEXs by Revenue
Decentralized exchanges continue to be foundational to web3’s economic engine, powering billions in swap volume across chains. In the last 30 days, these five protocols led the pack in terms of revenue generated from trading activity, mint mechanics, or aggregator fees.
Rank | Protocol | 30-Day Revenue | Primary Revenue Mechanism |
|---|---|---|---|
1 | $65.17M | Trading fees (~0.25% per swap) | |
2 |
Source: DeFi Llama
Key takeaways:
Perp DEXs are winning: Hyperliquid is out-earning most traditional DEXs with a single-chain footprint.
CoWSwap's MEV protection and PumpSwap's token launch fees represent entirely new ways DEXs can monetize beyond simple trading fees.
PancakeSwap's strategy of deploying across 9 chains generates the highest absolute revenue, proving that being everywhere users trade does matter.
Top 5 Lending Protocols by Revenue
Lending remains one of the oldest and most critical functions in DeFi — offering capital efficiency, leverage, and passive yield. While the hype around new tokens and narratives often overshadows it, lending protocols quietly generate consistent revenue by capturing interest spreads and loan fees.
Here are the top performers by the last 24-hour max revenue.
Rank | Protocol | Category | Chains | Max Daily Revenue | Primary Revenue Mechanism |
|---|---|---|---|---|---|
1 | Lending Market | Multichain |
Key takeaways:
Aave dominates the lending market by a wide margin — still the default money market for many institutional and DeFi-native users.
Kamino, Suilend, and Fluid represent lending infra growth and adoption in alternate chains like Solana and Sui.
Maple stands out with its niche focus on bringing private credit, institutional lending, and off-chain borrowers onchain.
Top Yield-Bearing Stablecoins by Revenue
Yield-bearing stablecoins are fast becoming web3's most sought-after financial instrument. These protocols issue or enable stablecoins that accrue yield through strategies like real-world asset backing, delta-neutral positions, or liquid staking integrations.
Here's how the top performers stack up by protocol revenue.
Rank | Protocol | Stablecoin Type | 30-Day Revenue | Primary Revenue Mechanism |
|---|---|---|---|---|
1 | RWA-backed stablecoin | $29.41M | Yield from real-world asset collateral + mint fees | |
Sources: DeFi Llama and TokenTerminal
Key takeaway:
Pendle's yield tokenization, Ethena's delta-neutral strategies, and Usual's RWA focus show that new entrants can capture market share by offering unique yield generation mechanisms
Top Telegram Trading Bots by Revenue
Telegram bots have quickly and surprisingly turned into serious revenue generators.
They are one of web3’s fastest-growing monetization layers: basically turning chat-based interfaces into full-fledged trading terminals. These bots simplify swaps, snipes, and onchain actions within Telegram, and they’re collecting serious fees from hyperactive retail users.
Here's who’s leading in revenue:
Key takeaway: UI/UX innovation drives adoption
These bots are successful in solving the friction of traditional DEX interfaces, showing that better user experience in web3 can command premium fees when it genuinely improves the trading workflow for users.
Top Risk Curators by Revenue
Risk curators sit at the intersection of capital allocation and strategy design. These protocols create, manage, and optimize vaults that generate yield — often through sophisticated strategies like lending loops, basis trades, or stablecoin arbitrage.
Users or LPs deposit capital; the risk curator deploys it, and revenue is earned through performance fees, management fees, or embedded spreads.
Rank | Protocol | Revenue (30d) |
|---|---|---|
1 | Re7 Labs | $188,144 |
2 | MEV Capital | $133,697 |
3 | Gauntlet | $105,756 |
Source: DeFi Llama
Key takeaway: Professional DeFi management is emerging.
These protocols represent the institutionalization of DeFi, where specialized firms earn meaningful revenue by providing investment management services.
All the numbers above are revenue and profitability-first. These unfortunately do not reflect in the token price today. While being hopeful of a better future, let’s take a look at the data from a more broader perspective and try to identify winner patterns in high revenue generating dapps.
Formulas Employed by High-Earning Dapps in 2025
After breaking down the revenue numbers, we are seeing some patterns beginning to emerge.
Zooming out, here are 5 patterns we can find:
Simple UX Wins
Examples: Telegram bots (BONKbot, Trojan), Phantom Wallet
Frictionless, intuitive UX is a revenue unlock. Bots that integrate directly into chat apps and wallets that simplify swaps or staking capture value by being where the user already is — with minimal learning curve.
Lesson: Users don’t want to “learn DeFi.” They want outcomes in one tap. Identify the biggest friction points in existing workflows, then build solutions users will pay to avoid that friction.
Simple beats free when the user experience gap is significant enough.
Financial Engineering Works
Examples: Hyperliquid, Ethena, Pendle
These dapps are not reinventing the wheel, they’re applying old financial strategies (funding rate arbitrage, basis trades, future yield tokenization) in a crypto-native wrapper. It’s all about structured risk with high yield potential.
Lesson: The best revenue comes from repeatable strategies that scale with volume and trust.
Specialization Commands Value
Examples: Maple (private credit), Kamino (concentrated Solana lending), CoWSwap (MEV protection)
Rather than trying to be everything to everyone, high-performing dapps pick a vertical and go deep. This sharpens their product-market fit, builds trust, and allows for premium monetization.
Lesson: Narrow focus = clear value = sustainable revenue.
Choose a specific user segment or use case and become the definitive solution for that niche.
Please do understand that these formulas aren't mutually exclusive. Most successful protocols often combine multiple approaches.
But each represents a proven path to sustainable revenue that builders can adapt to their own contexts and markets.
What Does The Future of Onchain Revenue Have in Store
Web3 has finally grown up.
The conversations have shifted from "wen moon?" to "how do you make money?" and that change reflects something bigger happening across the entire industry.
The data makes this clear. Protocols generating real revenue like PancakeSwap's $65 million monthly or Hyperliquid's $59 million aren't built on speculation.
They're built on users who find their services valuable enough to pay for consistently.
When users choose to pay for decentralized trading, yield optimization, or cross-chain infrastructure, they're voting with their wallets that these solutions actually work better than traditional alternatives.
Some takeaways worth repeating:
Revenue concentration is shifting: Away from just DeFi bluechips toward infra, bots, and UX-native apps.
Volume and velocity still matter: Trading-based dapps dominate the leaderboard, but financial engineering and distribution are just as critical.
Differentiation pays: The best-performing dapps do something specific really well and build defensibility around it.
As we move forward, remember that the generational leap web3 promised is happening right in front of our eyes.
It's just not happening through token prices or viral marketing campaigns.
It's happening through the boring but essential work of building profitable businesses that solve real problems.
Frequently Asked Questions (FAQs)
Why don’t high-revenue dapps always have high token prices?
Token value often reflects market sentiment or speculation, not the protocol’s underlying cash flow or product utility.
What percentage of Web3 protocols actually generate meaningful revenue?
While this report focuses on successful revenue-generating protocols, the reality is that fewer than 5% of web3 protocols generate sustainable revenue above $100K annually. Most struggle to move beyond token speculation to real business models.
Can web3 protocols become cash-flow positive without VC funding?
Yes — some trading bots, wallets, and MEV-aware infra services are already profitable through usage or volume-based fees.
What role do token incentives play in these revenue models?
Incentives can attract users, but long-term revenue depends on real utility. Subsidies distort actual product-market fit.
Are there successful web3 revenue models outside of DeFi and trading?
Currently, non-DeFi web3 dapps are struggling with revenue generation.
Gaming, social, and creator platforms show promise but haven't yet achieved the consistent revenue streams seen in DeFi.
About Quicknode
Founded in 2017, Quicknode deploys institutional-grade blockchain infrastructure for developers and enterprises. With 99.99% uptime and support for 80+ chains, teams build and scale onchain applications without compromise.
Stay updated
The latest engineering insights, product updates, and web3 news delivered straight to your inbox.